Introduction
Boasting features like Lumenore Connect for seamless integration of diverse data sources, Automated Dashboards driven by AI for intuitive visualization, and Ask Me functionality for natural language queries, it caters to users of all technical backgrounds. With its collaborative workspace, guided analysis capabilities, and smooth integration with Narrative Insights, data analytics significantly improves data accessibility, visualization, and decision-making processes. It emerges as a versatile tool for organizations seeking to effortlessly derive valuable insights from their data assets.
Overview
Lumenore stands as a premier data analytics platform, facilitating businesses in translating data into actionable insights. Leveraging a blend of machine learning algorithms and Advanced AI, Lumenore delivers easily digestible and impactful insights for end users. Through its Gen AI and natural language querying (NLQ) capabilities, Lumenore automates insights, simplifying data comprehension. The integration of interactive visualizations with cohesive narratives seamlessly converts intricate data into actionable wisdom for decision-makers. With no coding skills required, Lumenore fosters effortless and effective business data story.
Key features of Lumenore
- Powerful BI and Data Analytics Platform:
- Powerful platform designed for business intelligence and data analytics.
- The primary goal is to transform their raw data into actionable and reliable insights.
- Utilization of Machine Learning Algorithms and Advanced AI:
- Pool of machine learning algorithms along with advanced artificial intelligence (AI).
- Enhances the ability to process and analyze data, providing users with meaningful and easily understandable insights.
- Actionable Insight Discovery:
- Creating actionable insights.
- Strives to present insights in a way that encourages users to take practical and effective actions based on the information provided.
- Gen AI and Natural Language Querying (NLQ):
- User-friendly interactions.
- Making it easier to seek information and insights.
- Automated Insights for Simplified Data Understanding:
- Crafts automated insights, making it easier for users to understand complex data.
- This automation streamlines the data comprehension process.
- Fusion of Interactive Visualizations with Coherent Narratives:
- Distinguishes itself by combining interactive visualizations with coherent narratives.
- Complex data is not just presented visually but is also accompanied by clear and logical storytelling.
- No Coding Skills Necessary:
- Eliminates the need for coding skills.
- Can effectively utilize Lumenore for data storytelling and analysis.
- Facilitating Easy and Effective Business Data Storytelling:
- Users can communicate insights in a compelling and accessible manner, contributing to informed decision-making within the business context.

Lumenore offerings
Lumenore provides a wide range of features and functionality as a Business Intelligence and Data Analytics tool.
Connectors
Lumenore Connect allows users to effortlessly link data from diverse sources, including local files, databases, or live connections. With 80+ connectors, users can quickly create schemas and dashboards for effective data utilization.

Lumenore Data Magnet (In-built ETL tool)
Lumenore Data Magnet is a graphical user interface (GUI) based module that facilitates data integration by enabling users to extract data from various source systems, transform it, and deliver it in a presentable way. The available features of the Data Magnet are data extraction, transformation, and loading.

Dataset
A dataset is simply a collection of data, usually organized in rows and columns, much like a table in a spreadsheet. It contains information on specific topics, such as sales numbers, customer details, or product inventory. Each row typically represents a single entry or record, and each column represents a different type of information about that record (e.g., name, date, amount, etc.).
In Lumenore, a dataset stores the data you import from your datasource. Once the dataset is created, you can use it for various tasks like creating visual dashboards, running analyses, building reports, or gaining insights.

Schema
A schema is like a blueprint that organizes and structures data in a database. It defines how data is stored, the relationships between elements, and the rules for storing and retrieving data.
After creating a dataset, the next step is to build a schema, combining data from different sources by joining tables. This allows users to bring data from multiple tables into one unified model, making it easier to analyze and find insights.
The schema is essential for designing a well-organized database and helps ensure the consistency and integrity of the data.

Dashboards
A Dashboard is a robust tool for visualizing and analyzing complex data, presenting a snapshot of an organization’s KPIs and key metrics on a single screen. It serves as a central resource for monitoring data, revealing patterns, trends, and quickly assessing overall system performance.

NLQ-based Conversational Analytics
Lumenore Ask Me is an AI-driven conversational analytics tool that enables users to query business data using natural language. It leverages advanced natural language processing (NLP) to interpret and respond to user inquiries, making data insights accessible to users with varying technical expertise. By integrating data science, visualization, and root cause analysis (RCA agents), it extracts actionable insights from both structured and unstructured data, offering an intuitive and user-friendly experience.

Do You Know (Data Science Driven Advanced Analytics)
It is a comprehensive suite offering a range of no-code, AI-enabled analyses designed to empower users to execute intricate analytics tasks effortlessly. Positioned as an advanced augmented analytics engine, it actively seeks anomalies and patterns within datasets, presenting findings in insightful visualizations.

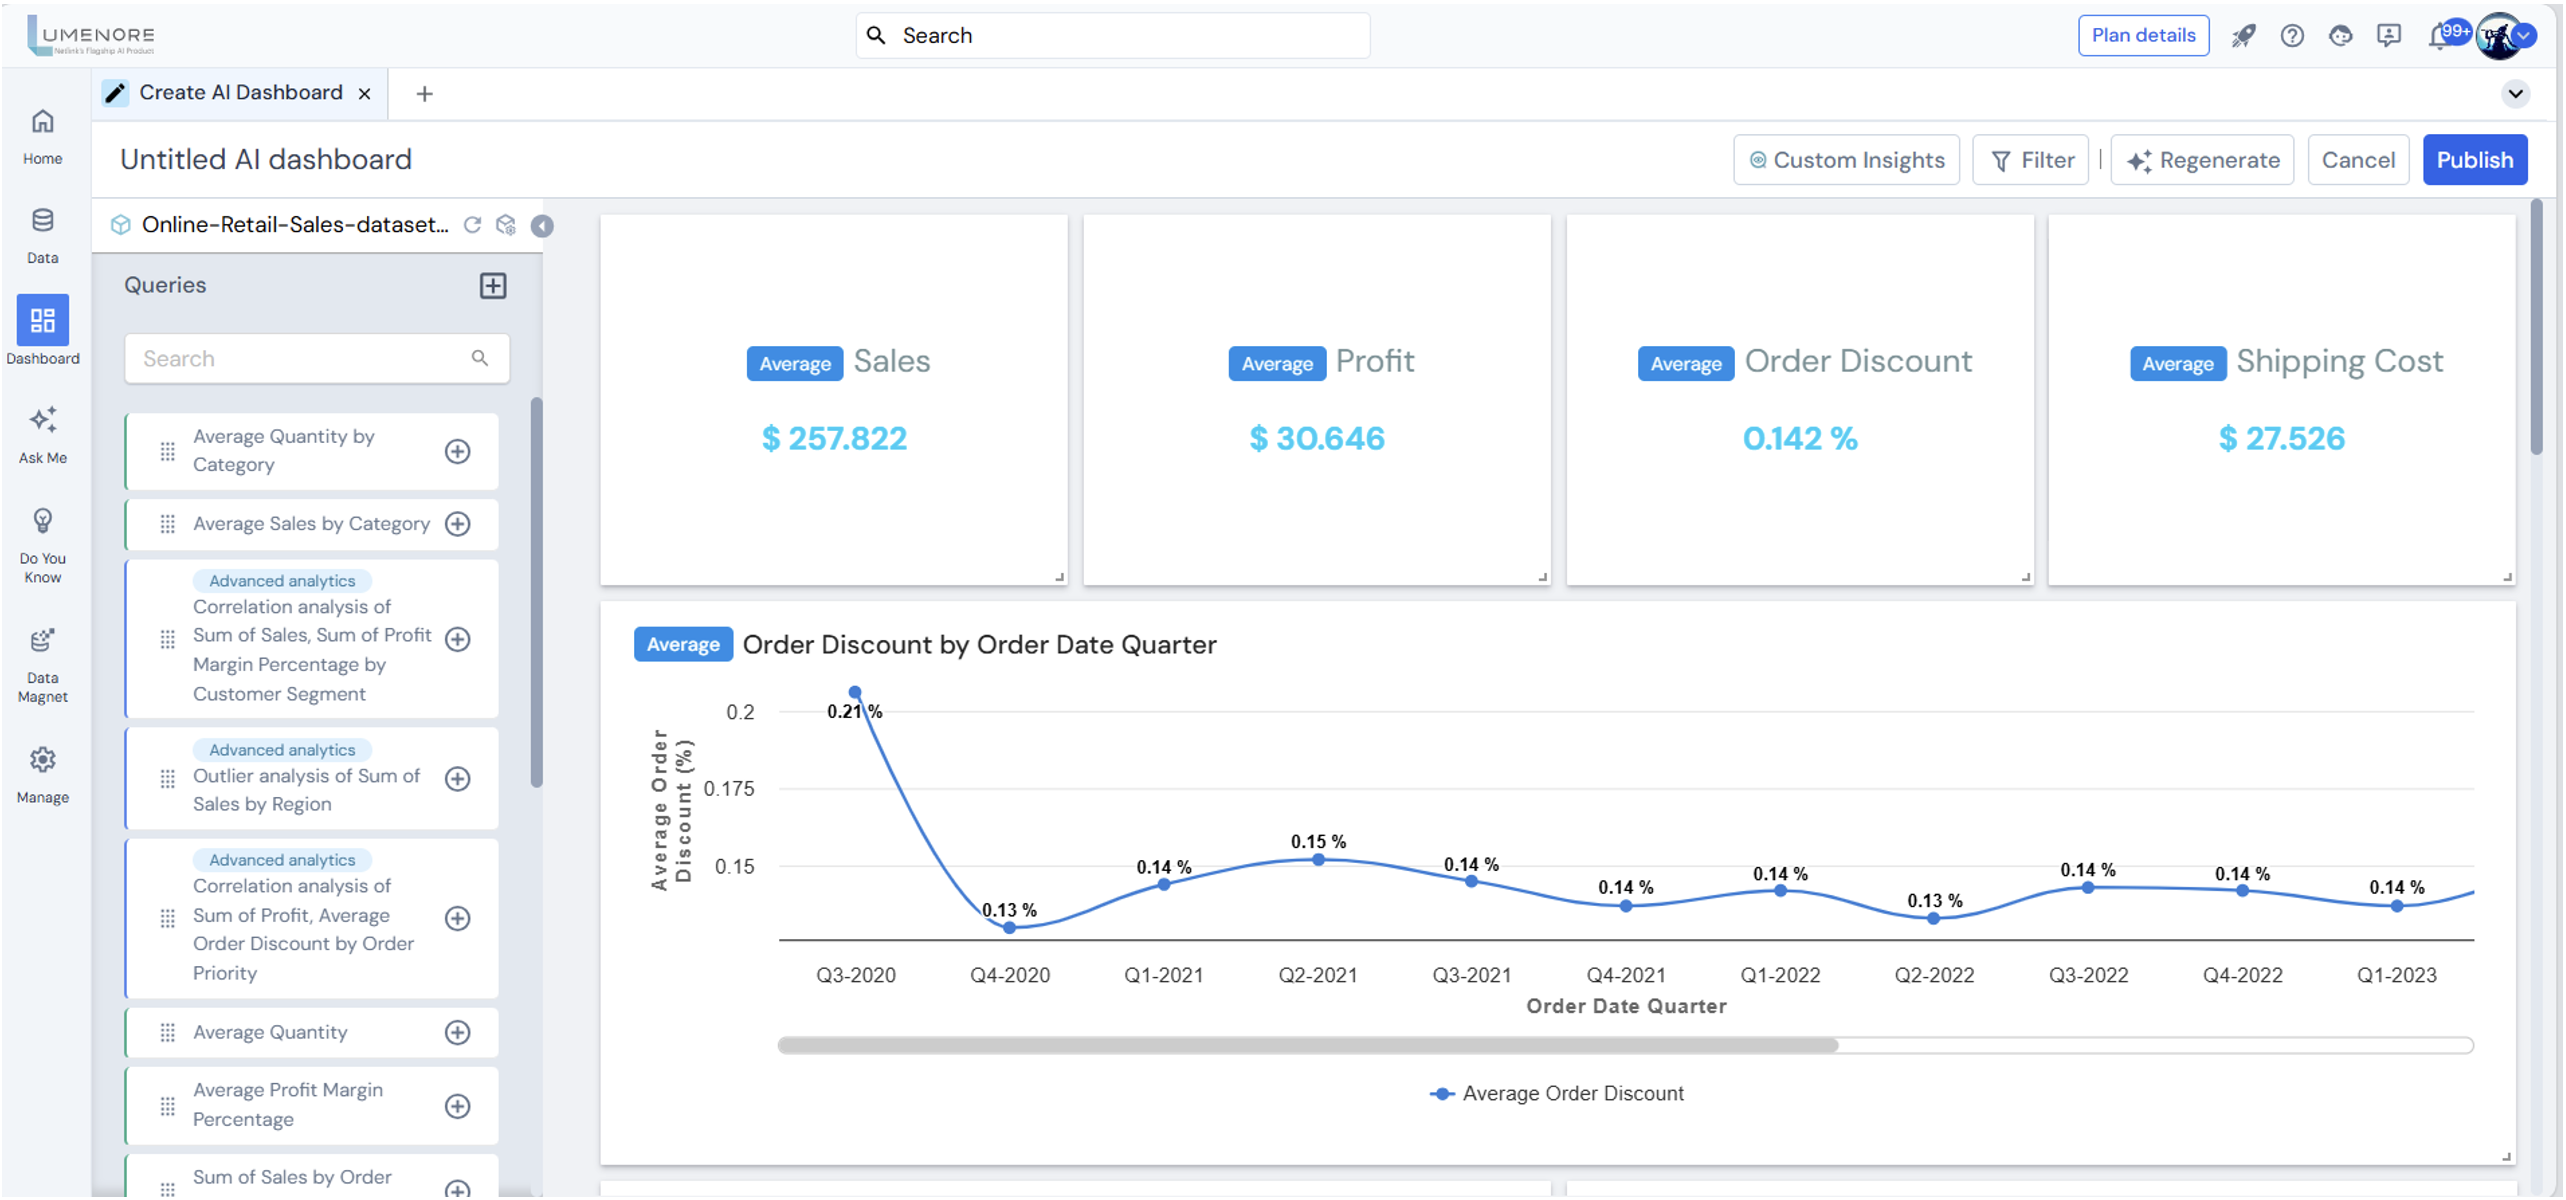
AI Automated Dashboard
Automated Dashboards in Lumenore use AI to simplify data visualization and insights, catering to users of all levels. Powered by Gen AI, it creates dashboards with common KPIs and filters swiftly. Personalisation options and integration with Narrative Insights enhance decision-making efficiency, promoting data-driven decisions effortlessly.
Manage
It provides users access to a management console to manage the following:
- Sharing
- Schedule
- Alert
- Publish
- Groups
- Embedded Objects

Users
It is designed for those who want to create, read, write, and modify their business intelligence reports and insights using a smart BI tool. Business users, researchers, data analysts, and government institutions can be the users.

Prerequisites
Users should have a basic understanding of data analysis, data formatting, KPIs, and various graphs and charts before diving into Lumenore’s functionalities.
*To delve deeper into Lumenore and analytics, access our learning portal.
Explore the extensive range of Lumenore features here: Lumenore in a Nutshell
