Using Lumenore Ask Me
Step 1: After logging into Lumenore, the user is directed to the home page.
Step 2: Click “Ask Me” available on the left side of the page.
Step 3: It brings the user to the landing page. Here, users will find a guide on getting started with Lumenore Ask Me, which includes three steps: selecting a schema, asking a question, and obtaining insights. Additionally, the landing page highlights the key features of Lumenore Ask Me.
Step 4: Users can enhance their learning by watching videos demonstrating how to start with Lumenore Ask Me, manage conversations, and ask advanced questions effectively.
 Step 5: To initiate the process, click “Start a New Analysis” or “+New analysis.” The user will then see the initial conversational module, which includes an introduction and several action point options.
Step 6: To begin the analysis, users can select a schema from the list of available schemas by clicking More Schemas. Users can also create a new schema if the required schema is not already available.

Step 7: Alternatively, users can select a schema by clicking on the “Select Schema” option located below and to the left of the search bar.
Step 8: Now, choose the desired schema.
Step 9: Users can access a set of sample questions tailored to the selected schema.
AI Readiness reflects how well your dataset is prepared to produce accurate, meaningful, and context-aware AI insights. The score represents how much essential metadata and business context have been added to help the AI correctly interpret your schema. To help you improve the score, Lumenore identifies key areas that need attention, such as the Schema Prompt and Business Context.
Depending on your needs, you can choose from the following actions:
- Review and Improve Score
Walks you through enhancing your AI readiness by updating the schema prompt, adding descriptions, synonyms, units, business context, and other metadata. - Continue Anyway
Allows you to proceed with the analysis, though the AI’s accuracy may be limited. - Don’t Show Again
Hides this notification in future sessions.

- A data readiness percentage is shown for each schema. You can enhance this score by navigating to the Schema Manager and using the Improve AI Score For further information, visit the AI Readiness Score guide.
Step 10: To switch models, use the dropdown menu in the ChatGPT interface to select the desired AI model.
- Lumenore Query Engine: A proprietary engine built by Lumenore for running basic data queries. It’s ideal for lightweight operations that don’t require advanced AI capabilities.
- Auto: Automatically selects the most suitable model based on the nature of your query. It helps balance performance and efficiency without needing manual selection.
- ChatGPT 4.1 Mini: This is a smaller, more budget-friendly version of GPT-4.1, designed for general tasks with moderate complexity.
- ChatGPT 4.1: A high-quality and versatile language model with strong reasoning skills. Suitable for more complex queries, detailed insights, and advanced analytics tasks.
- ChatGPT 4o Mini: A lighter version of GPT-4o that balances cost and performance well. Ideal for quick, everyday interactions that need decent accuracy without high computational demand.
- ChatGPT 4o: The latest and most advanced model, offering improved speed, accuracy, and multi-modal capabilities (text, image, and audio). Best suited for complex reasoning, dynamic content generation, and high-performance tasks.
Step 11: Click Schema Info. It allows users to define formulas for calculations when the required metric is not directly available in the data.
- Attributes (/a):
Displays all available dimensions and categorical fields in the selected schema, such as Customer, Region, Product, or Date. Users can reference these attributes while framing questions. - Measures (/m):
Lists all numerical metrics and KPIs available in the schema, such as Sales, Profit, Quantity, or Revenue. These measures can be used to perform calculations and analysis. - Sample Questions (/q):
Provides example business questions based on the selected schema. These examples help users understand the type of queries that can be asked and serve as a starting point for analysis.
Step 12: Preview Data
Preview Data allows users to view a sample of the dataset associated with the selected schema. It helps users understand:
- What data is available for analysis
- The structure of the dataset (columns, data types, values)
- Whether the data is relevant before asking questions
This feature is useful for quickly validating the data and gaining context before performing any analysis in Ask Me.
Step 13: Query Guidelines provide suggestions for framing questions effectively so that Ask Me can generate accurate and meaningful results.

Step 14: Lumenore Ask Me offers two ways to input queries: typing in the search bar or speaking after clicking the microphone button.

Note: Now ask your questions in natural language, and Lumenore Ask Me will provide the results you want. It will understand your query despite spelling mistakes and provide accurate results.
Step 15: Chart interaction features:
- For a better view, maximize the screen.
Note: Users can engage in follow-up conversations by asking questions about their previous query, as Lumenore Ask Me understands the context and maintains continuity.
- AI insights
AI Insights automatically analyzes your dataset or dashboard KPIs and generates meaningful observations, trends, patterns, and explanations. It highlights what’s changing, why it’s happening, and what you should pay attention to, helping users get instant, data-backed interpretations without manual analysis.
These insights may include:
-
- Trends (e.g., sales increasing month-over-month)
- Anomalies (e.g., sudden spike in costs)
- Drivers and contributors (e.g., which region impacted revenue)
- Correlations or relationships between KPIs
- Forecasting-based insights
- Regenerate:
The Regenerate option lets you refresh or recreate AI insights for a single selected KPI. Instead of regenerating insights for the entire dashboard, this focuses the AI on a single metric, ensuring more accurate, relevant, and deeper observations.
- Data Summary
Data summary is accessible for all generated KPIs. The data summary provides an overview of the dataset’s structure and calculations, including:
-
- Total rows: The number of rows in the dataset.
- Total rows after removing null values: The number of rows remaining after excluding null or missing values.
- Order by: The sorting order applied, in this case, by “TotalSales” in descending order (DESC).
- For each: The grouping criteria used here, grouped by “City.”
- Calculated: The calculated metric, which is the sum of “Sales” presented as “Total Sales.”

- SQL Query
The SQL Query option allows users to view the underlying query that generated the chart or visualization. It provides transparency into how the data is being fetched, aggregated, and displayed.

- Change Chart Type
The Change Chart Type option lets you switch the current visualization to a different chart format instantly. Instead of rebuilding a chart from scratch, you can choose another chart style from the menu, such as bar, line, area, scatter, stacked, or any other available type.
This feature helps you:
-
- Compare how your data looks across different visual styles.
- Quickly identify trends, patterns, or outliers that may be clearer in another chart type.
- Improve the presentation of insights based on your audience’s needs.
- The best way to visually communicate with your KPI or dataset

- Fit to Width
The Fit to Width option automatically adjusts the chart to fill the whole available horizontal space on the screen. When enabled, the visualization becomes easier to read, especially when dealing with many categories or long labels, by removing the horizontal scroll and allowing the chart to stretch neatly across the dashboard.
- Download
The Download option lets you save the chart directly to your device. Depending on the platform’s export options, the chart can typically be downloaded as:
-
- Image
- CSV
- Excel
The Email option allows you to share the chart via email directly from Lumenore. You can send the visualization to team members or stakeholders without manually exporting and attaching it.

- Save
To save a specific KPI, click the “Save” icon. To view saved KPIs, select the “Saved Cart” located on the left side of the screen. Upon clicking the Saved Cart, the user will see a list of all saved KPIs.

- Share
The Share panel lets you share your chart, insights, or KPIs with others via In-apps, WhatsApp, or Teams.
Sharing Options:
-
- Full Response: Shares the complete visualization, including:
- The chart
- Summary values
- Any contextual details shown in the view.
- Useful when you want to share the entire output as seen on screen.
- AI Insights: If enabled, the shared content will also include AI-generated insights related to the chart (trends, patterns, explanations). If unchecked, only the visual output is shared.
- Sharing Platform
You can choose how you want to send the shared content:
-
- In-app
- Share directly with users inside Lumenore.
- Add users by typing “@.”
- WhatsApp
- Send the chart or insights directly through WhatsApp.
- Teams
- Share via Microsoft Teams so teammates can view and discuss insights on your collaboration channels.
- In-app
You can select one or multiple platforms. Recipients get the shared content in their notifications or shared items list.
Step 16: Three analysis modes are available:
- Visual Mode: Presents data through interactive charts, graphs, and other visual elements for easy interpretation.
- Narrative Mode: Provides a text-based summary of insights, explaining trends and key findings in detail.
- Visual + Narrative Mode: This mode combines visuals and text to offer a comprehensive data view, blending clarity with detailed explanations.

Step 17: Clear Context
Clear Context removes all previous conversation history, filters, selections, prompts, and analysis steps that the system used to generate your insights. It resets the AI’s working memory, so it no longer considers past queries or instructions.

Step 18: Pin Analysis
Users can save the entire analysis using the pin feature for easy access. To remove it, click on the “unpin icon.”

Note: The maximum limit for pinned analyses is 5.
Step 19: Privacy Summary
To ensure transparency and user awareness, Ask Me includes access to a security message and a privacy summary when generating AI-based responses. This helps users understand how their data is handled while using GenAI features.
Step 20: To delete a pinned or recent analysis, click the Trash icon next to the item. You can also use the menu by selecting the three dots in the top-right corner and choosing Delete.
Step 21: Rename
You can assign a name to your analysis for easier identification.

Step 22: Side Drawer
The user can open and close the side drawer, which provides access to options such as saved insights, pinned analyses, and recent analyses.
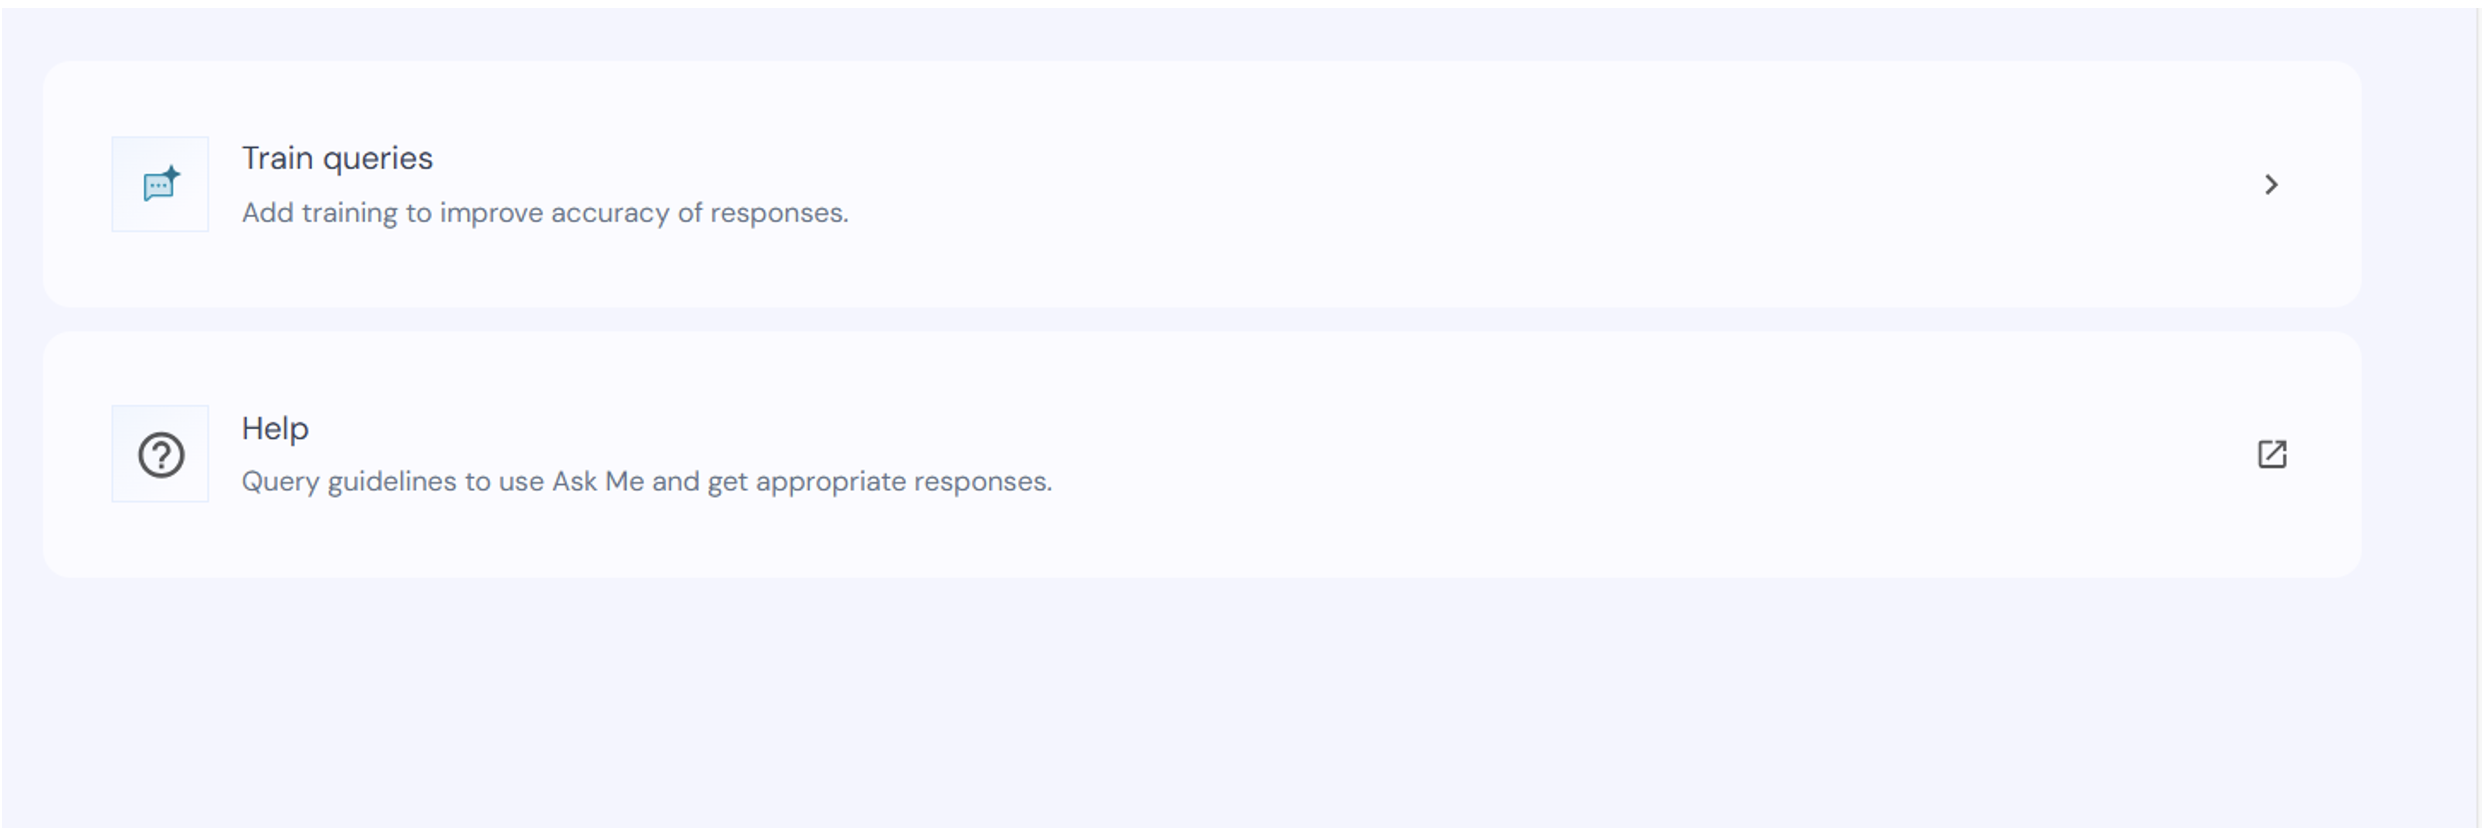
Step 23: Setting & Help
Train Queries
The Train Queries option allows users to enhance the accuracy of Ask Me responses by adding custom training.
- Users can define how specific questions should be interpreted
- Map queries to correct SQL logic and visualizations
- Improve future responses for similar questions
Help
The Help section provides access to query guidelines and usage instructions for Ask Me.
- Offers best practices for framing questions
- Helps users understand how to interact with the system effectively
- Improves the quality and accuracy of generated responses