Workspace
The Left Panel in the Lumenore Data Integration Layer provides quick access to the key tools you need to build, manage, and run data workflows. It helps you connect to data sources, create workflows (called graphs), schedule jobs, and monitor execution.
After clicking on My Workspace, the user can see five options:
Actions
Under the “Actions” section, users will see three action categories listed below:
Source:
This is where your data journey begins.
- Import data from various file formats like Excel, CSV, JSON, etc.
- Connect to databases or cloud platforms.
- Or, manually enter custom data using Data Grid.
Target:
Once you’ve transformed or processed your data, the Target option helps you export or store that data into:
- A database table
- A local file system
- A cloud storage system like Google Drive, Dropbox, or S3
Transformation:
Use this to clean, format, and prepare your data. Examples include:
- Removing null values
- Changing data types
- Applying calculations or conditional logic
Click the arrow beside each category to view all available tools under that section.

Connections
Connections allow Lumenore to link with external data systems like databases or cloud services.
- View all saved connections by clicking Connections.
- Click the three-dot menu next to a connection to:
- Edit – Update connection details (e.g., credentials)
- Delete – Remove the connection
- Click the “+” icon to create a new connection.
- Use the Refresh icon to reload the list and display newly added connections.
- Use the Search bar to find a connection by name quickly.
- Use the Sort By option to sort connections by name or date.

Graphs
Graph is a visual workflow that helps users design and execute data pipelines in a simple, drag-and-drop interface. It connects different components, such as data sources, transformations, and output actions, to define how data flows and is processed. Users can build, preview, and run data processes step-by-step without writing code by arranging and linking these components.
Upon clicking the three dots corresponding to the graph name, the user will get three options:
- Clone: To make a similar copy of the graph with a different name.

- Schedule: Refers to a predefined plan or timeline for running automated data processes and generating logs. Schedules allow these tasks to occur at regular intervals (e.g., daily, weekly) without manual intervention, ensuring timely and consistent data analysis and reporting.

- Delete: To remove the graph.

Note: A step, the smallest unit within the graph, serves various purposes such as loading data from diverse sources, joining or union of data, applying transformations, filtering unwanted data, selecting necessary data, and saving data.
Graph Status Indicators:
- “D” icon – Draft: Graph is saved but not finalized.
- Schedule icon – Indicates the graph is scheduled.
- Green – Schedule is active.
- Red – Schedule is paused.
To delete a draft, click the three dots next to it and select delete.

Jobs
A job comes in handy when there’s a requirement to unite multiple graphs for processing data from various sources. A helpful approach when dealing with multiple sources for data extraction and writing is to break down the task into smaller, manageable graphs. Subsequently, these graphs can be joined together within a job for execution.
- Upon clicking the drop-down arrow, you can view all the available jobs.
- Upon clicking the three dots corresponding to the graph name, the user will get three options:
- Clone: To make a similar copy of the graph with a different name.
- Schedule: Refers to a predefined plan or timeline for running automated data processes and generating logs. Schedules allow these tasks to occur at regular intervals (e.g., daily, weekly) without manual intervention, ensuring timely and consistent data analysis and reporting.
- Delete: To remove the graph.
Note: Steps are the same as shown in the Graph.

Scheduler
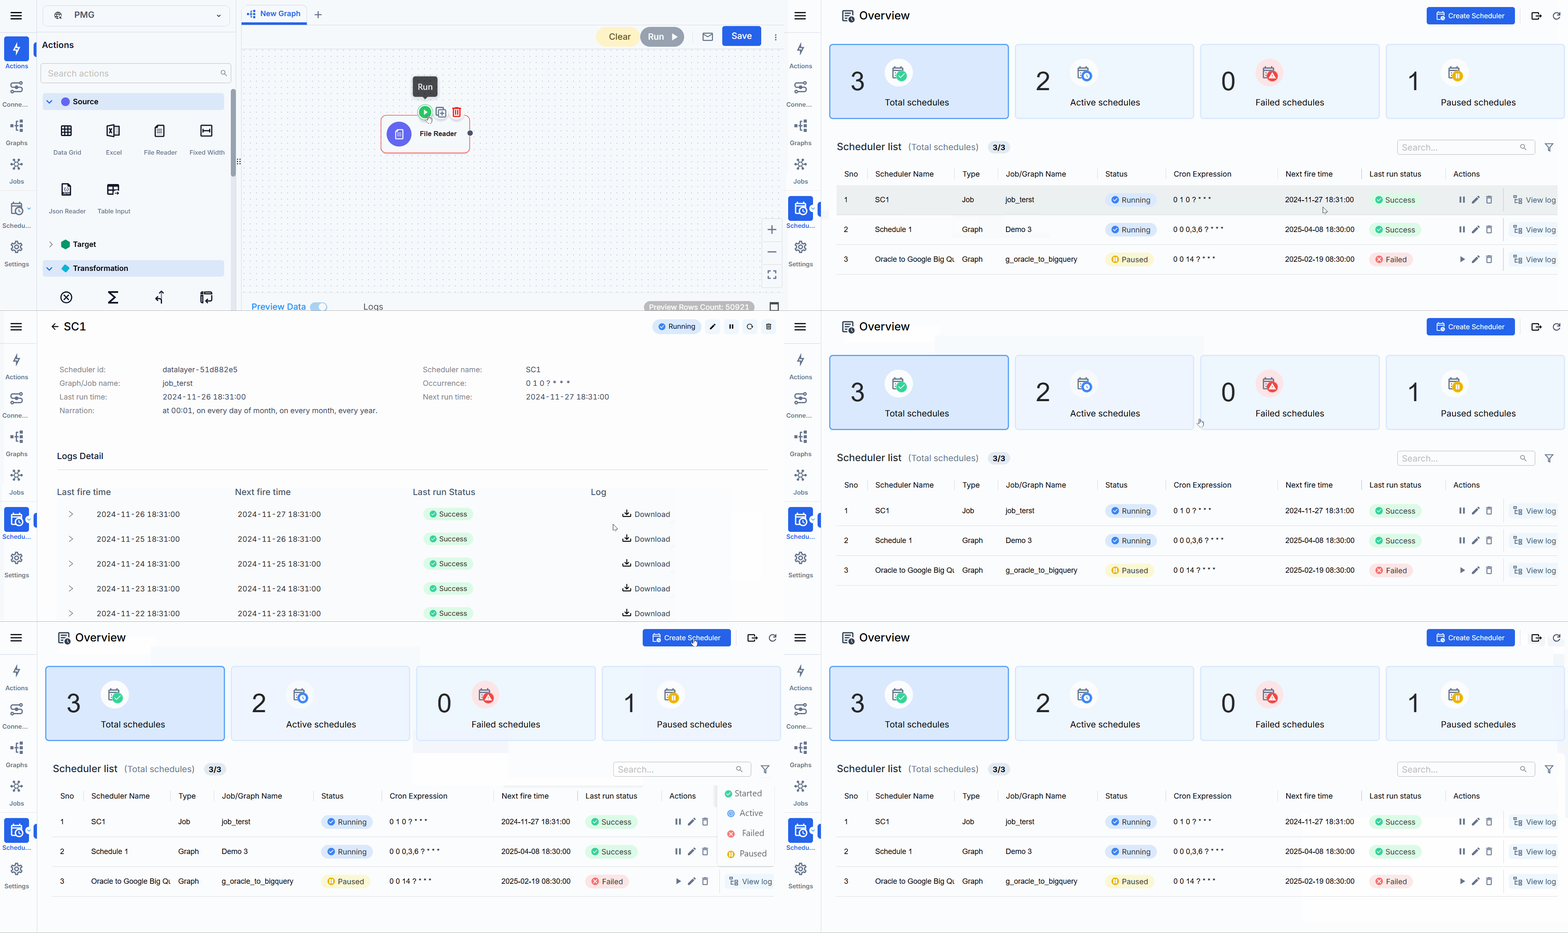
Scheduler keeps a history of all scheduled jobs and helps ensure your data flows are always running on time.
Click on the “Scheduler” in the left panel.
- Click the three-dot menu to:
- Resume, edit, or delete a schedule.
- To refresh the scheduler, click the refresh icon in the top right corner.
- To access detailed log information, click on “View Logs.”
- To download the logs, click the download icon at the top right. The log download feature aims to improve user convenience, optimize competition parity, and enhance metrics tracking in the Data Layer.
- Create Scheduler: (Top-right) To add a new schedule.
- Filter/Search: (Top of the table) To search specific schedules.
Setting
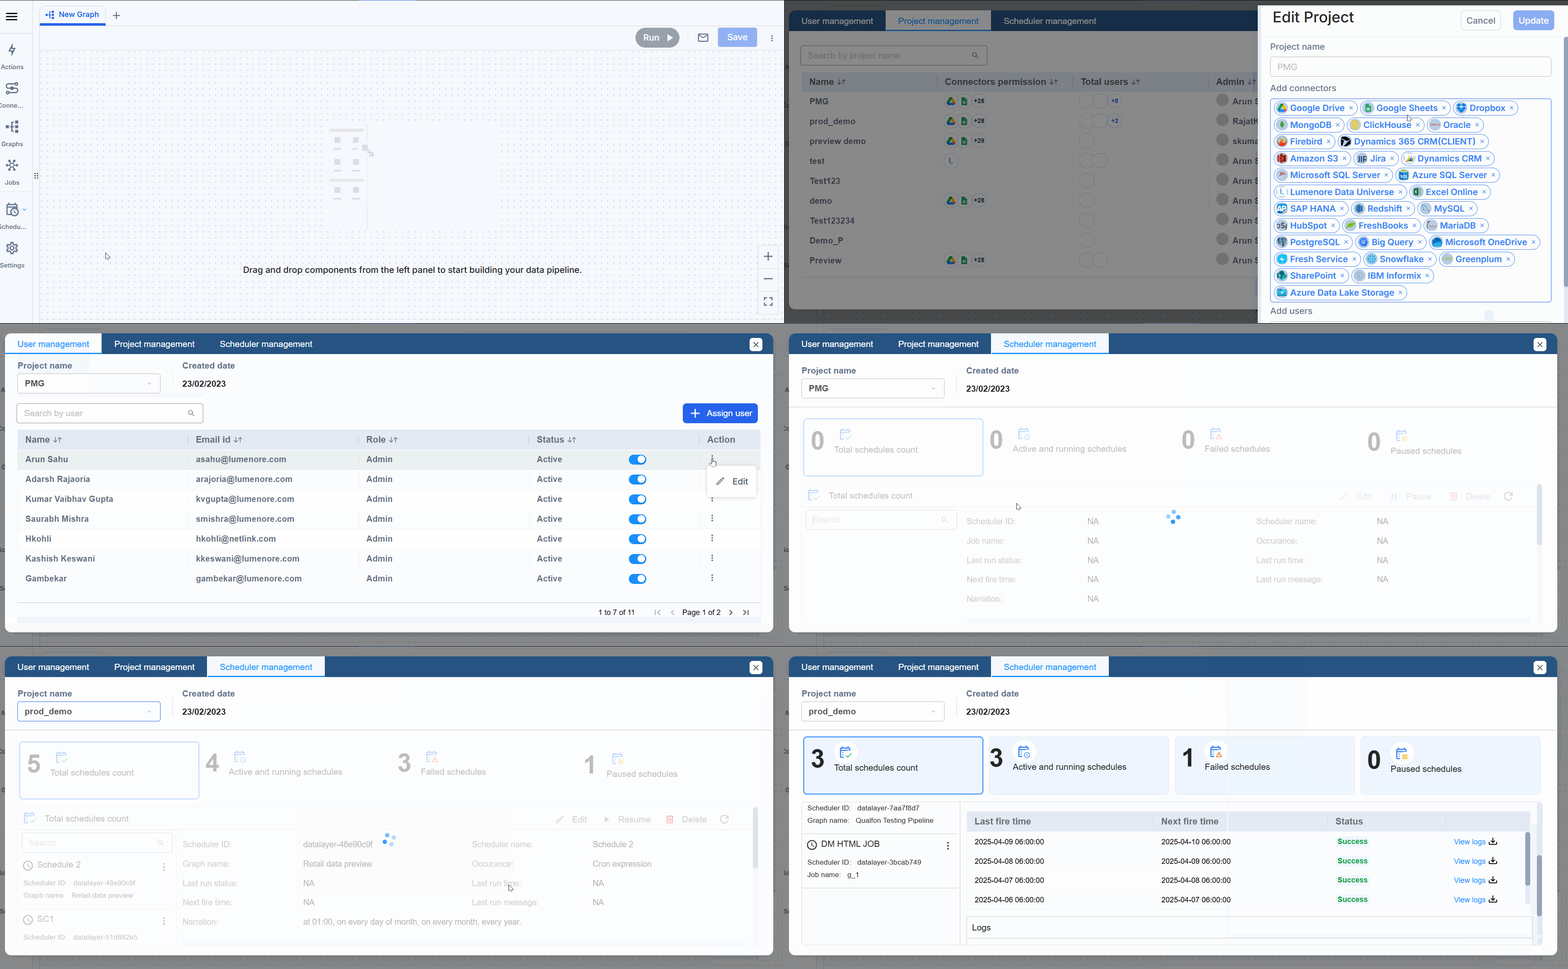
Clicking Settings will take you to the Admin or Management page, where you can:
- Configure system settings
- Manage users
- Access administrative tools
For more details, refer to the “Welcome Admin” page.
General Information
Refresh
Clicking on the three dots allows you to refresh the list.
Search
Type the name of the connections, graphs, or jobs in the search bar to locate the desired item quickly.

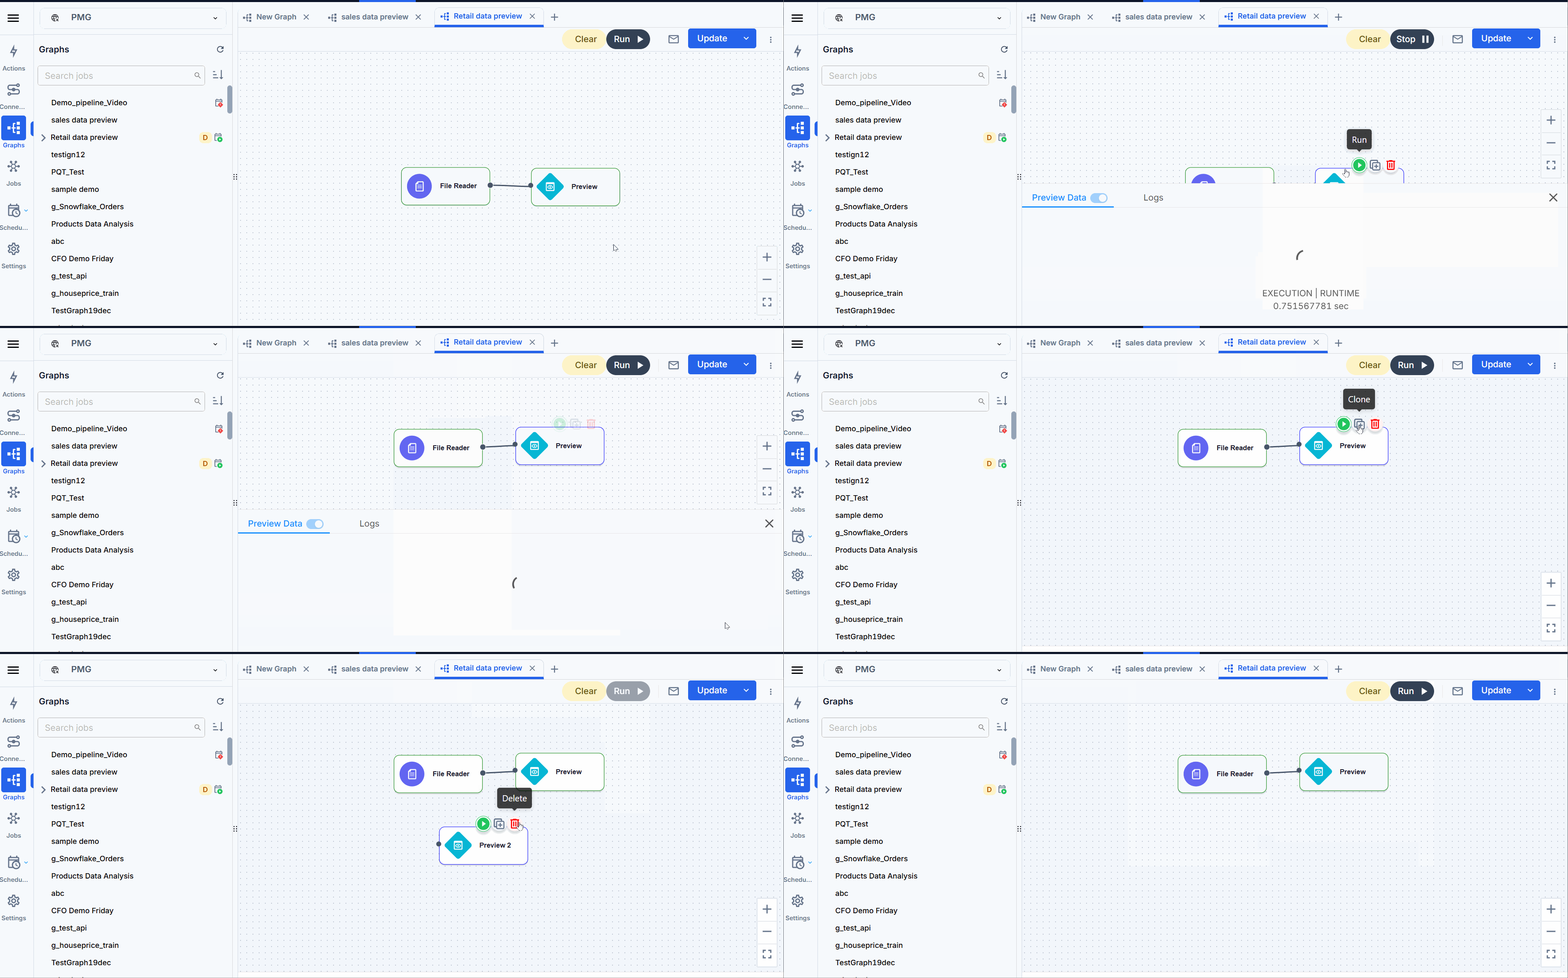
Action buttons on the component: The components in the canvas will present three options given below:
- Delete Component: This option removes the selected component.
- Clone Component: This option duplicates the selected component.
- Run Step: This option executes the selected component and generates the output.
Component information tab
When users open a component, they see a “How does it work” tab. Clicking on it briefly describes the component and explains its purpose and functionality.

