Dashboard
Introduction
The Lumenore Dashboard is your central hub for easy access to all your previously created dashboards, storyboards, and workspaces. Dashboard Tab allows users to create, view, edit, and manage published dashboards, including Manual Dashboards, AI Dashboards, and Storyboards.
It provides a consolidated view, allowing you to effortlessly find and interact with all your essential data and insights in one place. This section is designed to enhance your productivity by bringing all your key resources together, making it simple and convenient to stay on top of your work.
In Dashboard tab user can:
- Create a new Custom Dashboard
Let users build a dashboard manually by selecting datasets, visualizations, and filters. - Create a new AI Dashboard
Auto-generates dashboards using AI based on a given dataset or question—ideal for users who want quick insights. - Create a new Storyboard
Enables users to create a presentation-like flow of insights by linking charts, text, and visuals from dashboards. - Introduction Video
Opens a short introductory tutorial to help new users understand how to get started with dashboards.
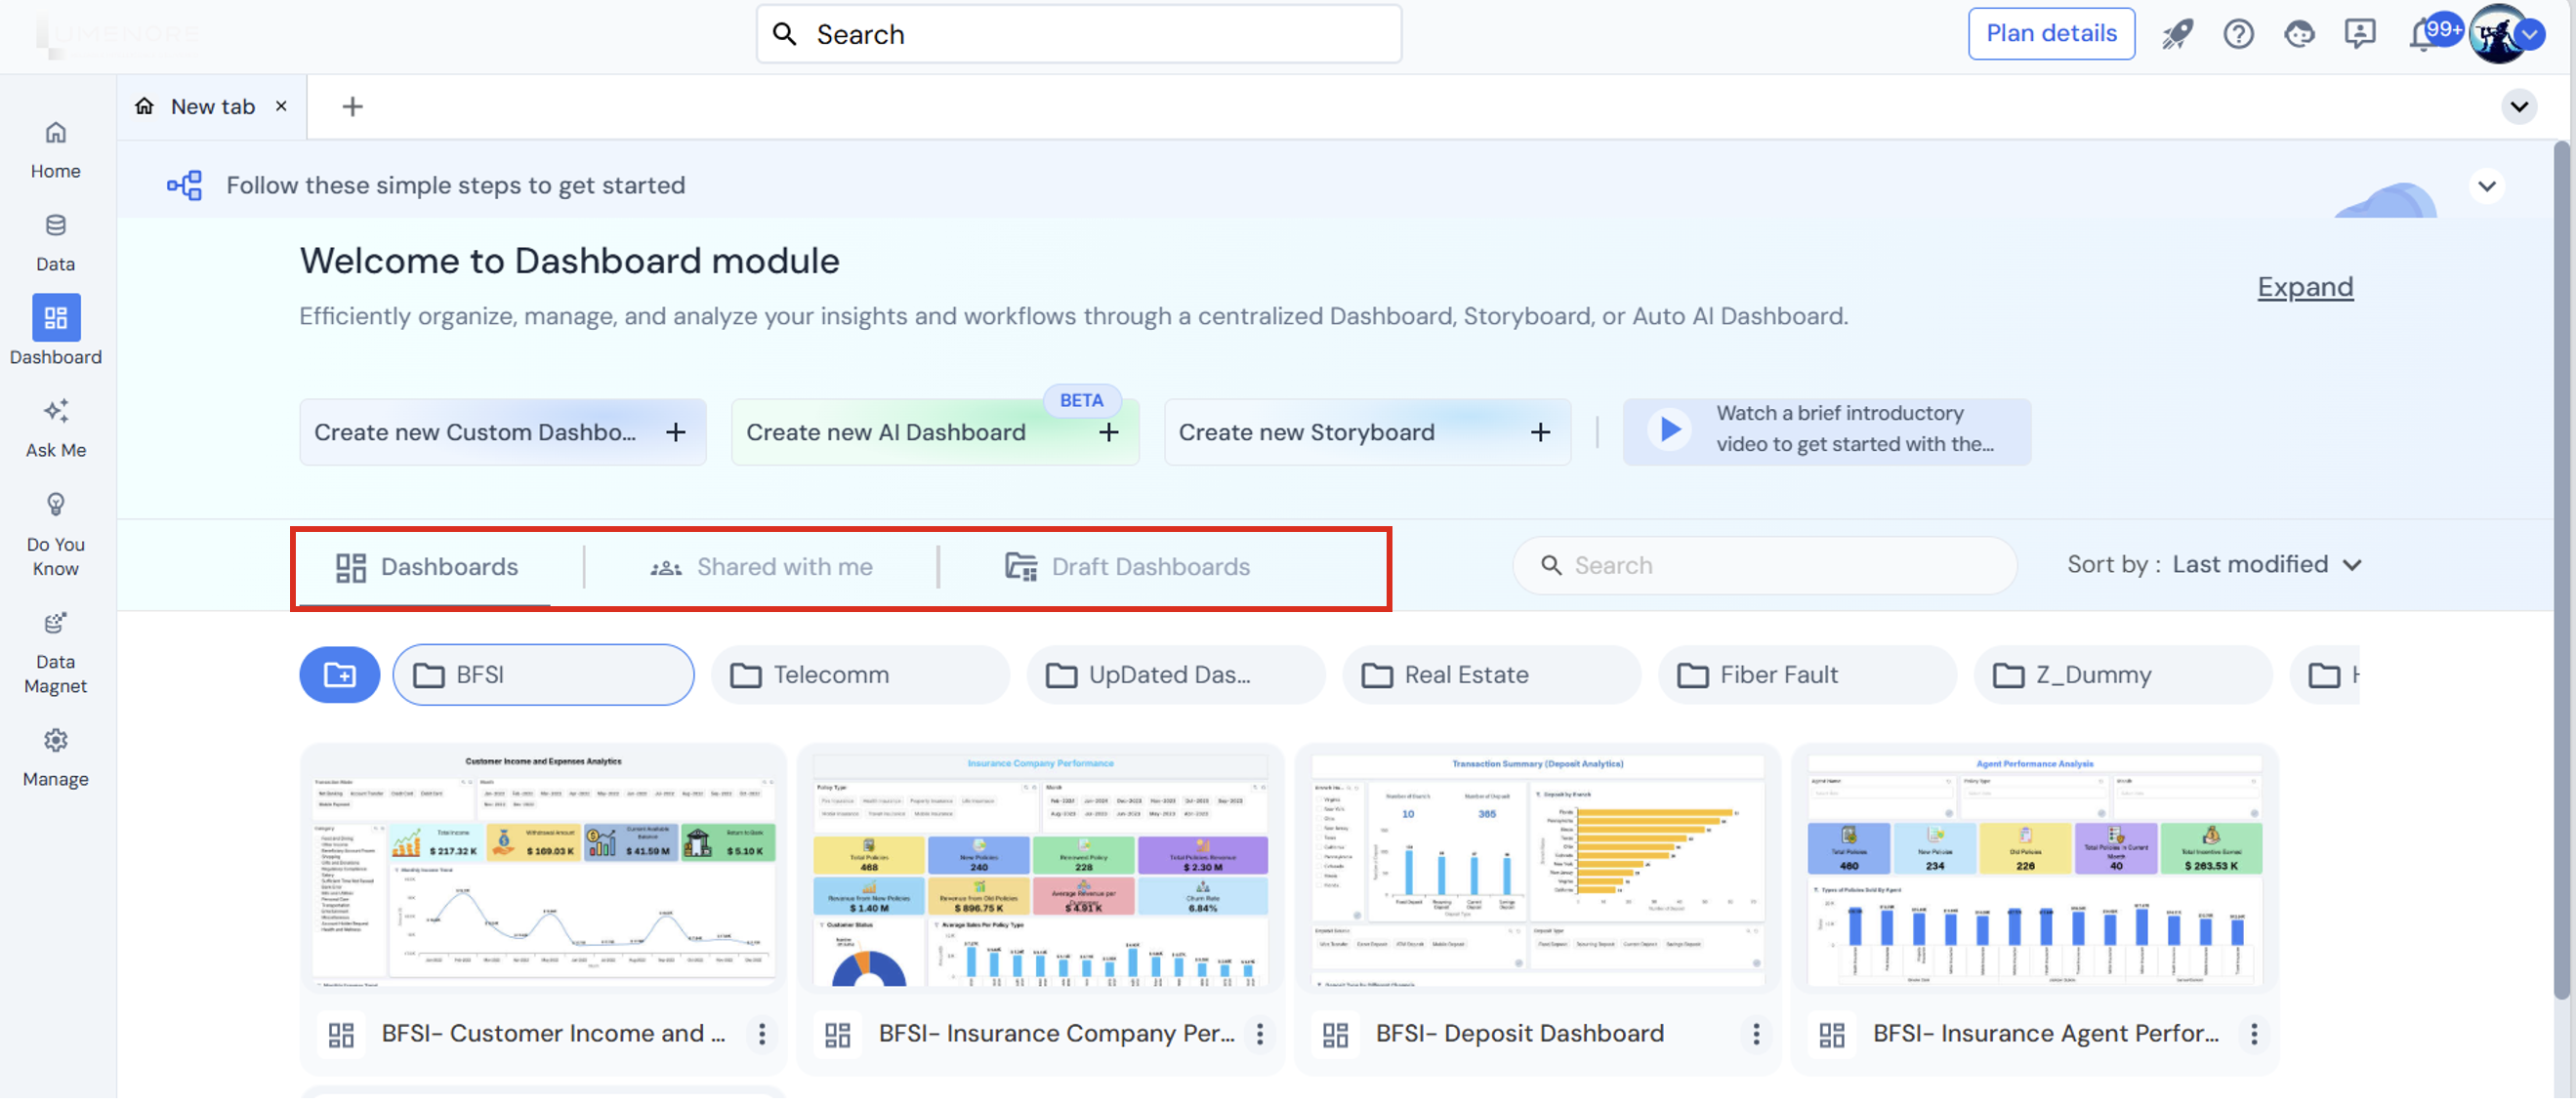
- Dashboards: The default tab where all created dashboards are shown, grouped by folders (like BFSI, Telecom, etc.).
- Shared with me: Displays dashboards that other users have shared with you.
- Draft Dashboards: Shows dashboards that are still in progress (not yet published or shared).

