Curved stacked area chart
A curved stacked area chart is a type of area chart that combines the features of both a stacked area chart and a curved line chart. It is used to display and compare data over time or across categories, where multiple variables are stacked on top of one another, and the areas have curved lines instead of straight lines connecting them.
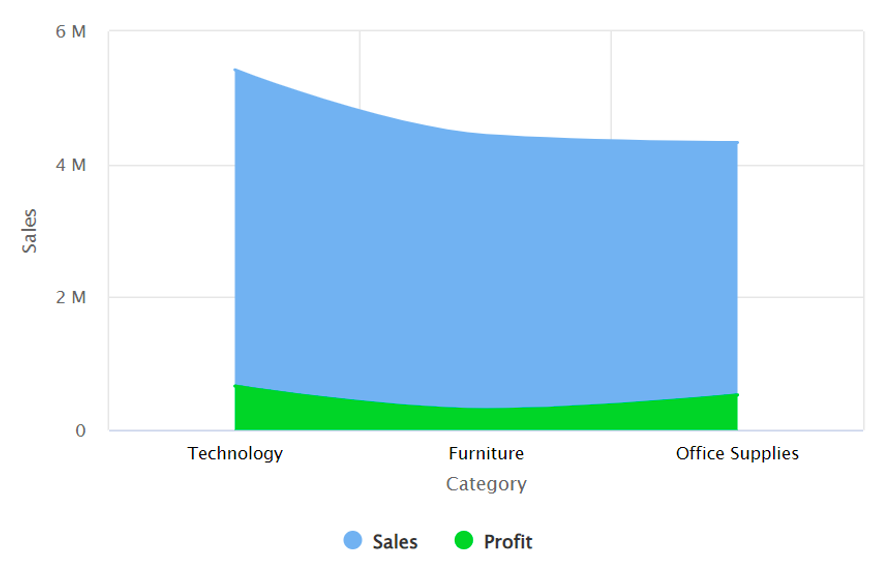
Example: The company aims to analyse its service categories, focusing on sales and profits. The curved stacked area chart analysis will provide insights into the relationship between sales and profitability, enabling the company to make informed service decisions.