Microsoft Excel
The Excel connector imports data from Excel files into Lumenore for analysis. You can upload files directly from your local system via drag-and-drop or by browsing or pull CSV files from supported cloud storage services such as S3, Dropbox, Google Drive, OneDrive, and SharePoint. Once uploaded, the data becomes available for querying and analytics.
Import Guidelines:
- Supported formats: .XLSX, .XLS, .XLSM
- Header row: The first row must always contain column headers
- No blank rows or columns within the sheet
- No macros or formulas
(Copy and paste data as values into a new sheet to avoid errors) - Remove formatting (except date formatting) before uploading
- Avoid special characters in sheet names (e.g., (), *, %, #)
Steps to connect:
Step 1: Navigate to Home > Connect Data > Select Connector > Excel.
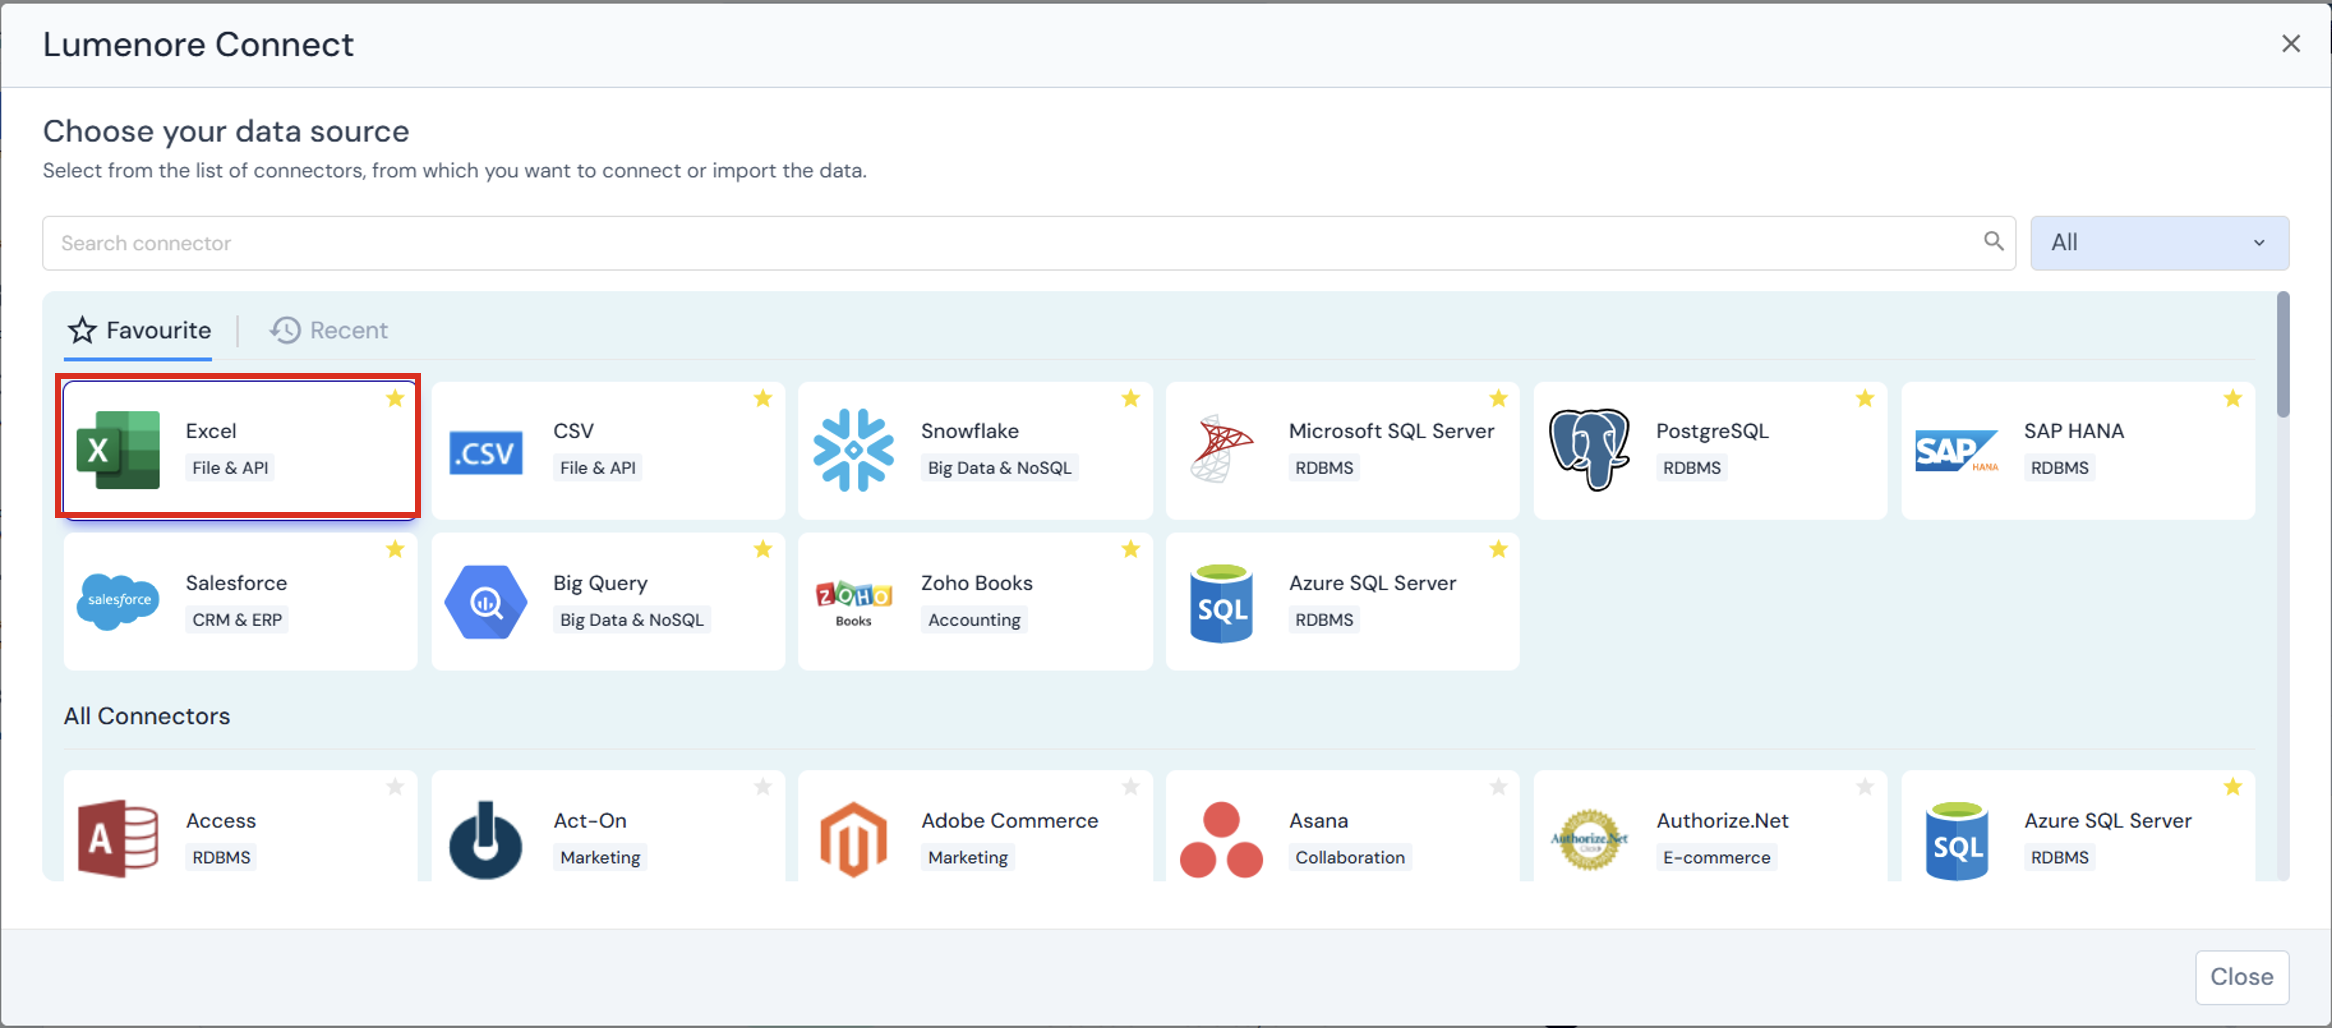
Step 2: Click “Browse File.”
Step 3: Select the file. The upload progress will be displayed.
Step 4: Once the file has loaded successfully, the file name appears in the download box.
Step 5: The next button is now enabled. Click “Next.”
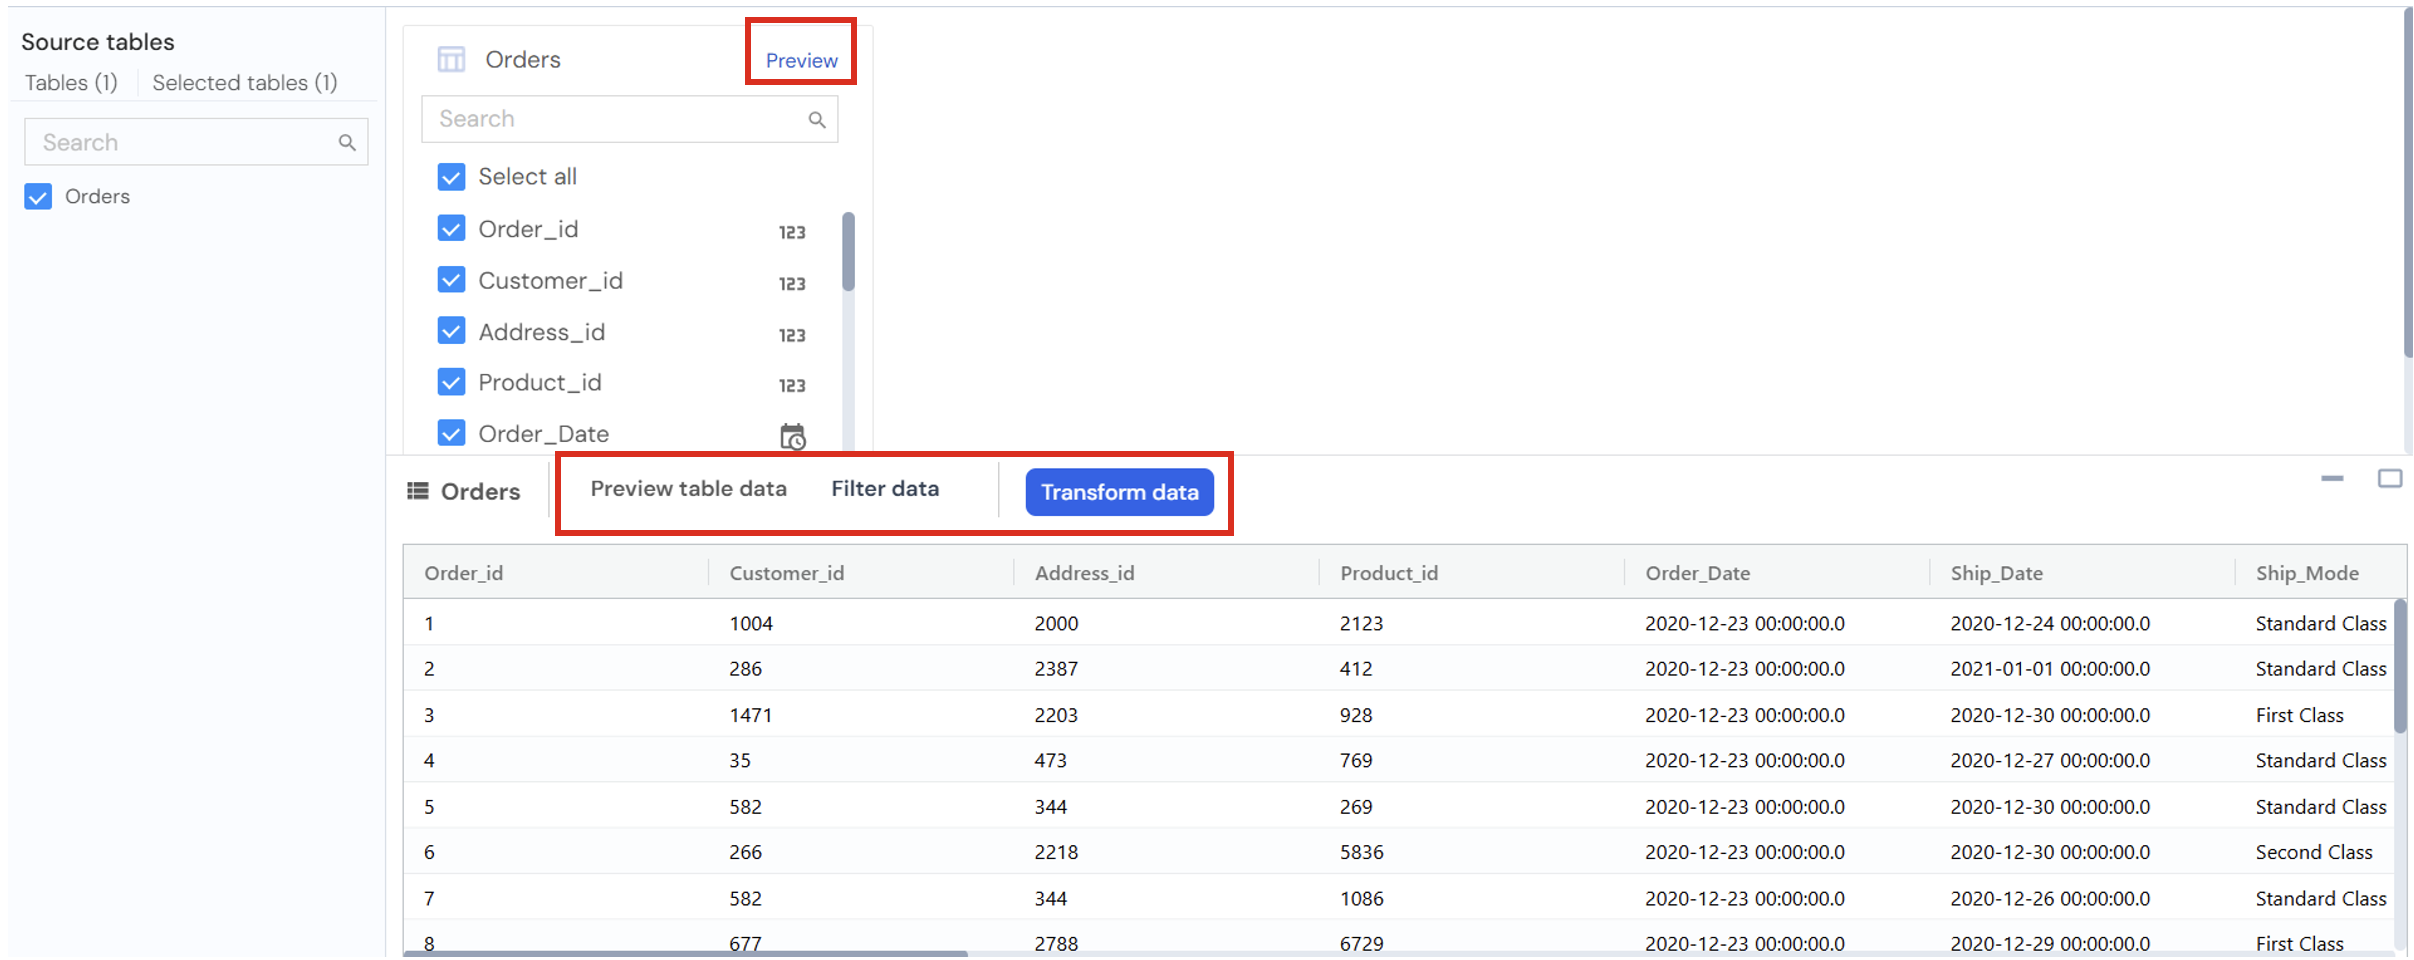
Step 6: Select the table you want to export from Excel to the Lumenore database. You can also view the data by clicking the Preview tab.

Step 7: The Preview tab allows you to preview the table data, apply filters, and perform transformations.
Filter data
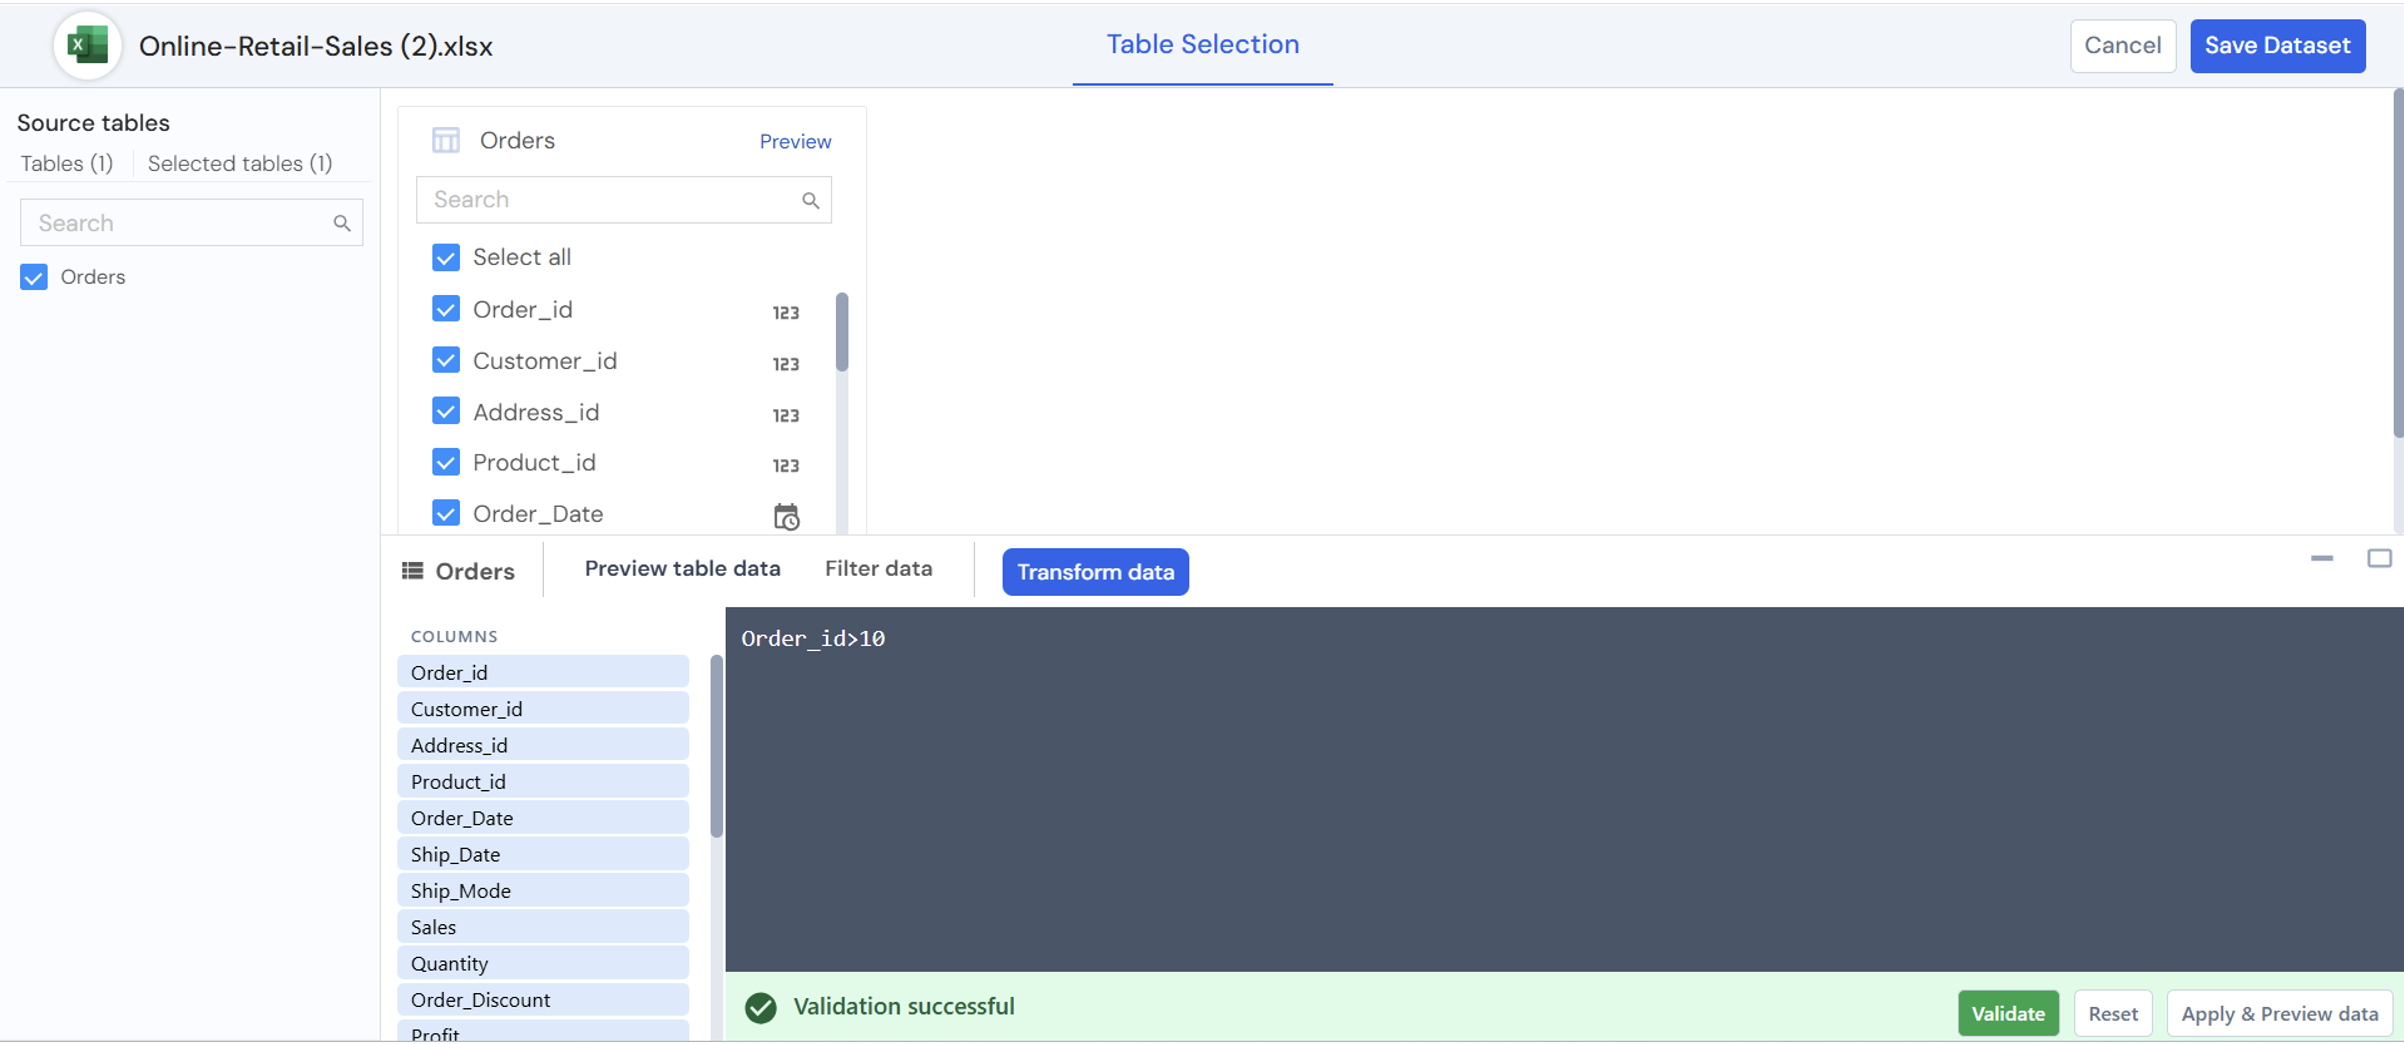
The Filter data section allows you to restrict the rows loaded from the selected table based on specific conditions.
Example: The filter condition is Order_id > 10. This means only records with Order_id> 10 will be included in the dataset.
- Filters are applied at the data ingestion stage, helping reduce unnecessary data and improve performance.
- After defining the condition, click Validate to check if the filter logic is correct.
- Once validation is successful, select Apply & Preview data to view the filtered results before saving the dataset.
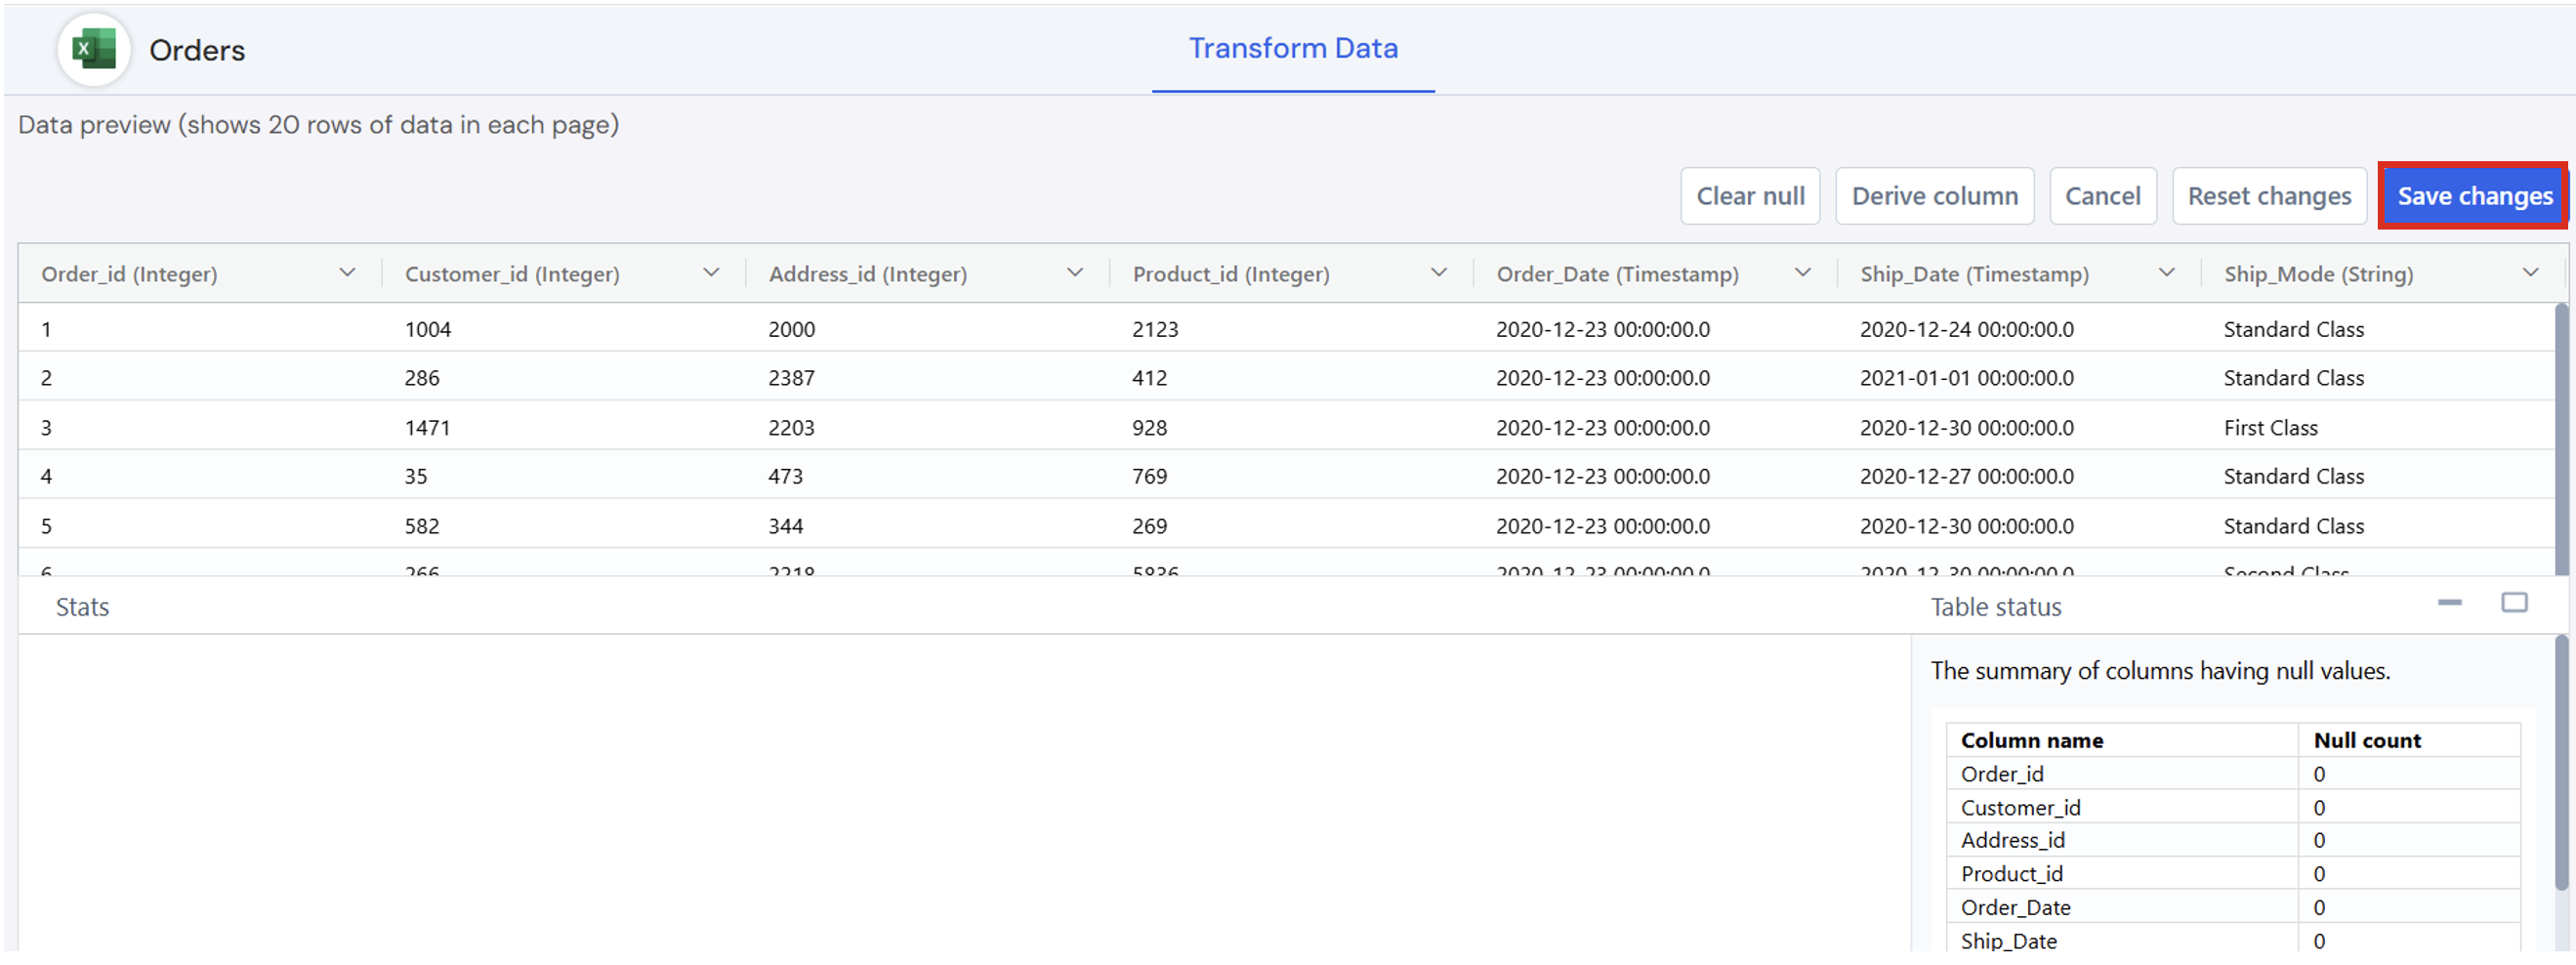
Transform data
The Transform Data tab below provides options for cleaning and enriching your data before loading it into the database.
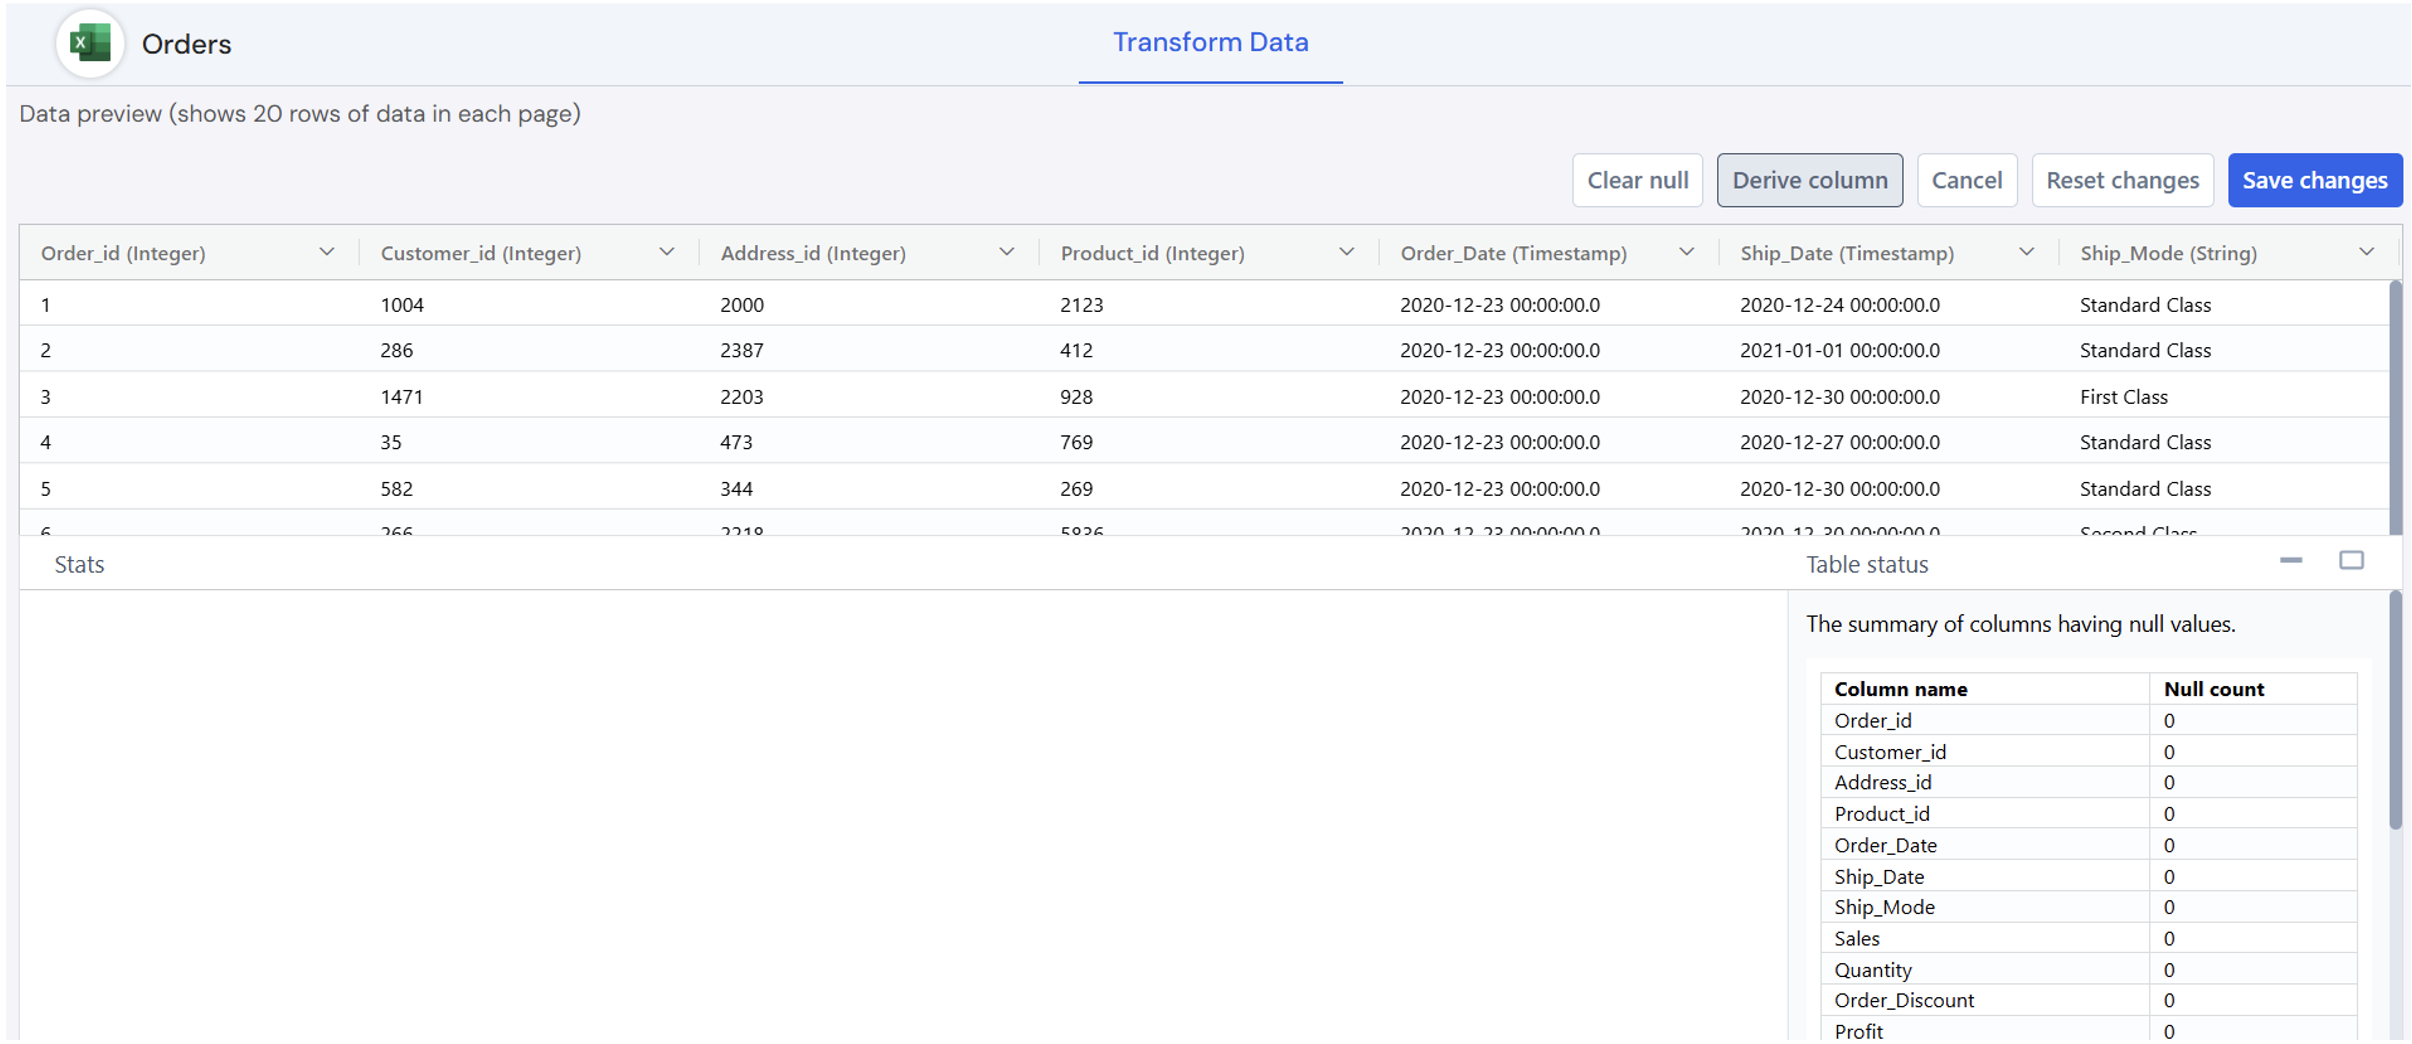
- Clear Null
-
- Removes or handles null (empty) values from the selected column.
- Helps improve data quality and avoid errors during analysis.
- Useful when null values are not required or may impact calculations and KPIs.
- The user can also see the summary of columns having null values.

- Derive Column
-
- Allows you to create a new column using expressions based on existing columns.
- Common use cases include:
- Calculating date differences (e.g., delivery time)
- Creating conditional columns (e.g., status flags)
- Concatenating or transforming values
- You must provide:
- Column Name: Name of the new derived column
- Column Expression: Logic or formula used to generate the values
- Click Validate & Add to verify the expression and add the column.

- Reset Changes
-
- Reverts all transformations applied in the current session.
- Restores the data to its original state before any transformations were made.
- Useful if you want to start over.

- Cancel
-
- Discards the current transformation action without saving.
- Close the transform window and return to the previous screen.
- No changes are applied to the data.

- Save Changes
-
- Applies and saves all selected transformations.
- Ensures the transformed data is used in the dataset creation process.
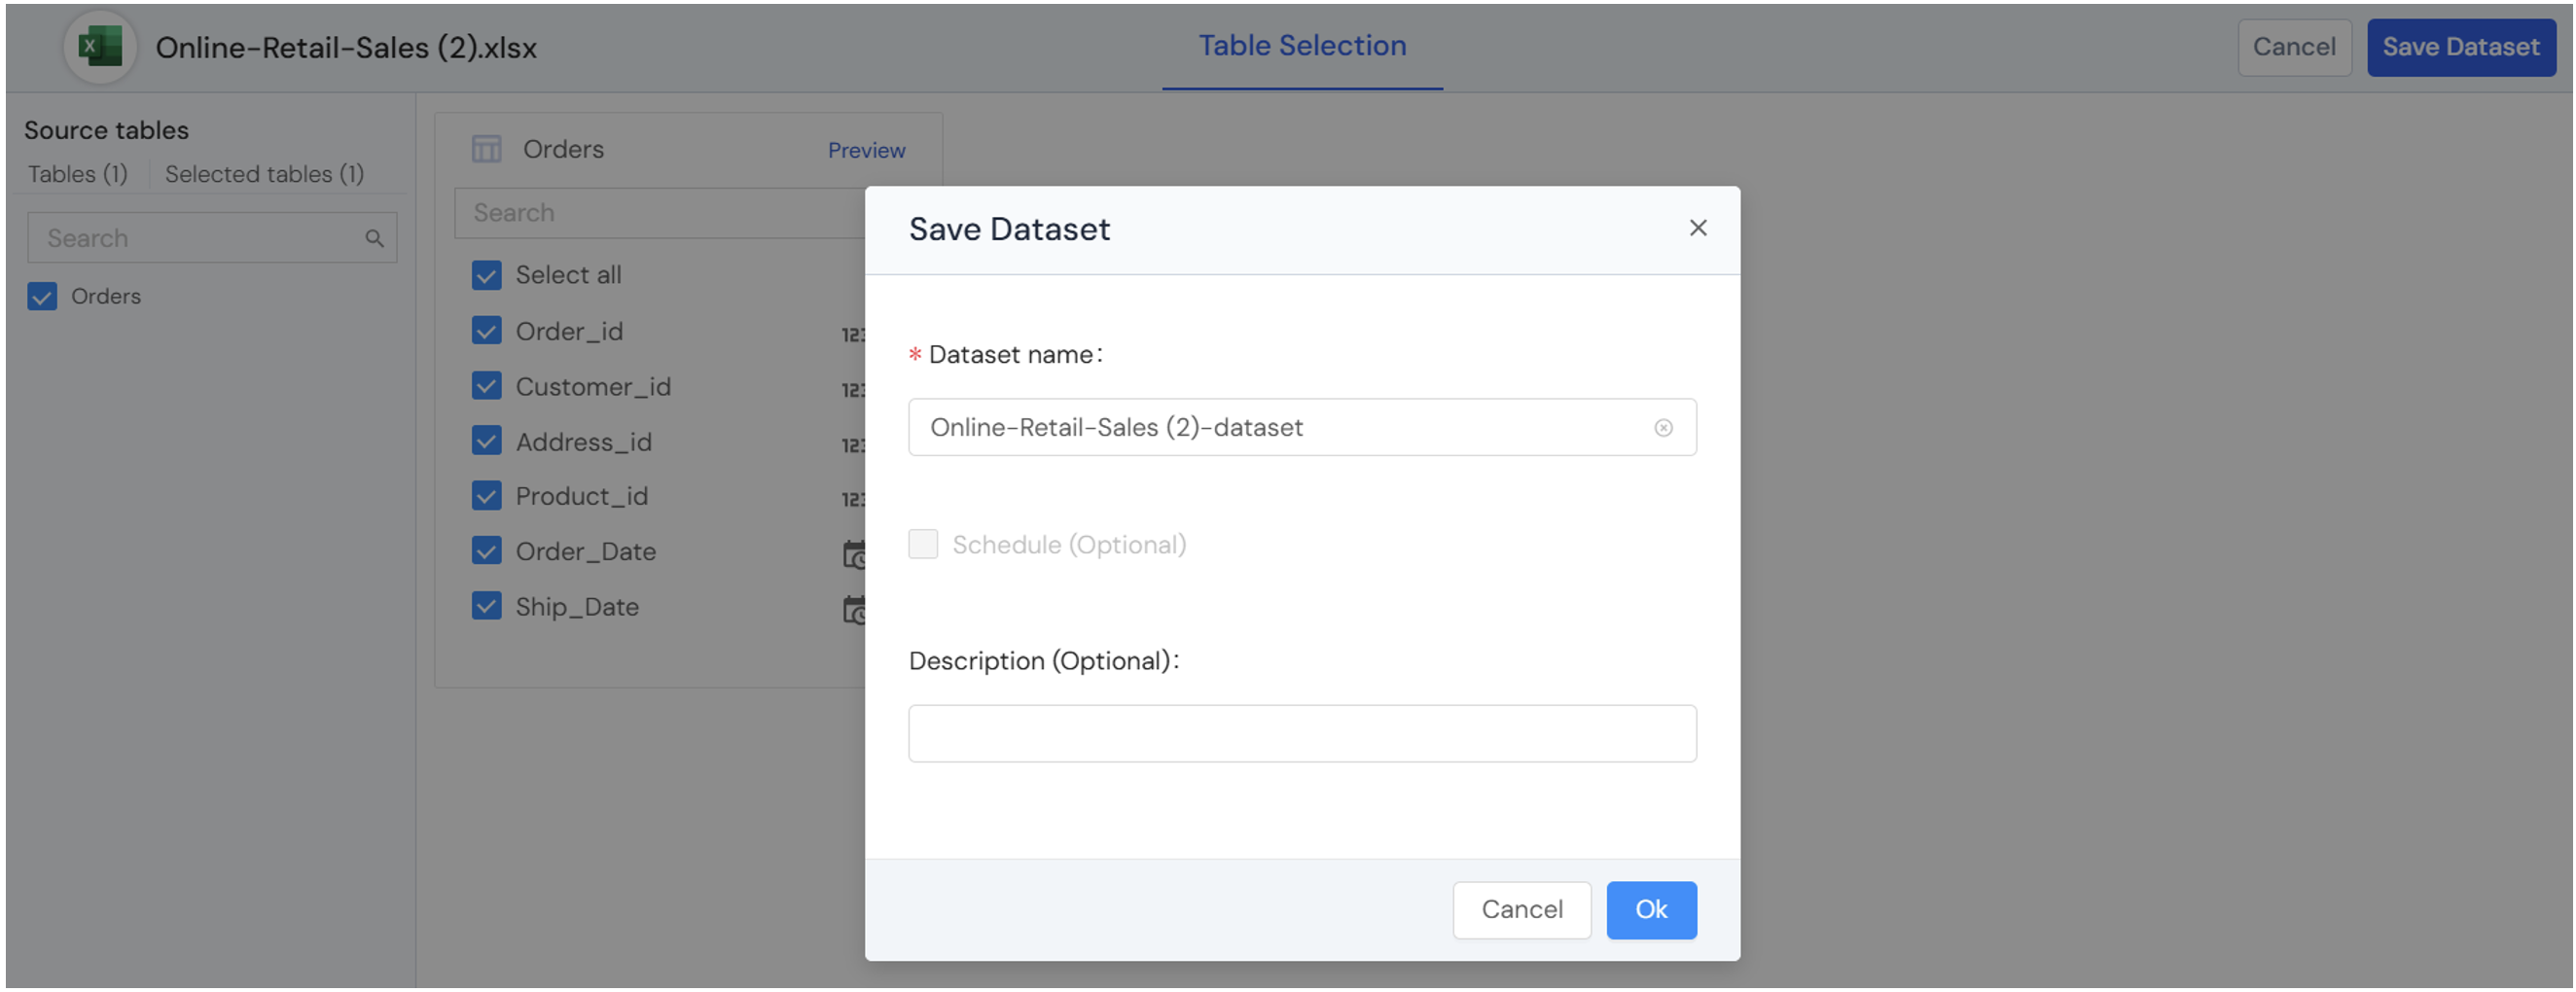
Step 8: Click “Save Dataset” to complete data ingestion.

Step 9: Provide the Dataset name and description (optional). Click Ok.
Step 10: A “Dataset created successfully” message is displayed. After this, the user can cancel and start using the dataset or create a schema by clicking the Create Schema option.

Below are the cloud connectors available for Excel:
