Stacked Symbol Bar Chart
A Symbol Stacked Chart is a type of data visualisation that combines elements of a stacked bar chart with the inclusion of symbols or icons to represent data points within each stacked bar. This type of data visualisation is used to convey information about data composition and provide a visual representation of individual data points within the context of a larger category.
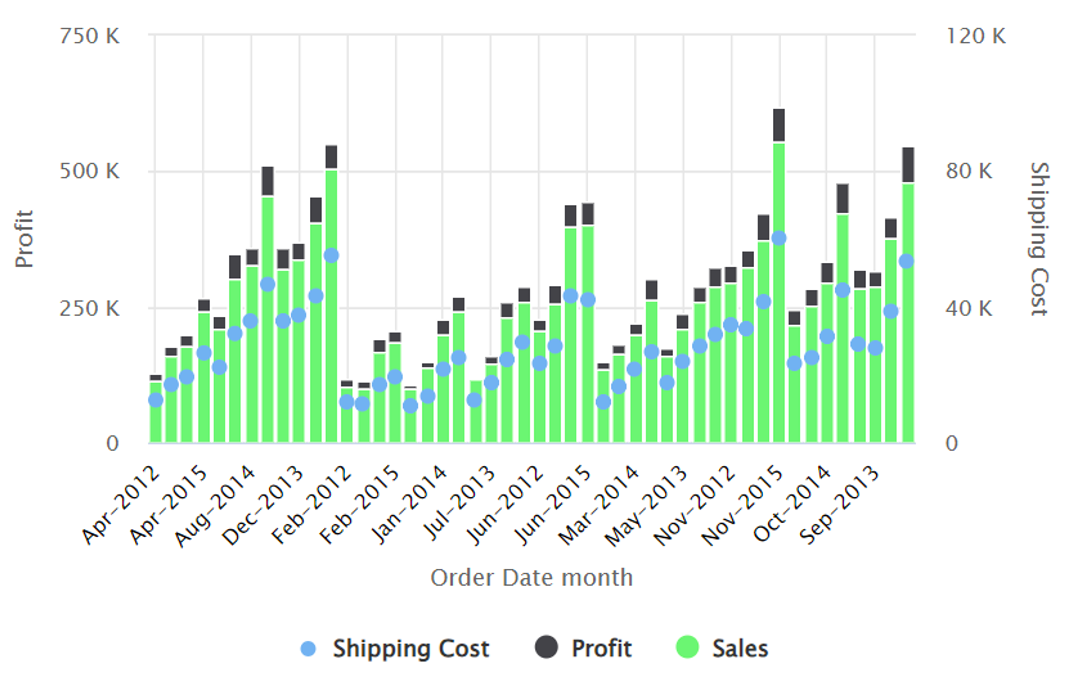
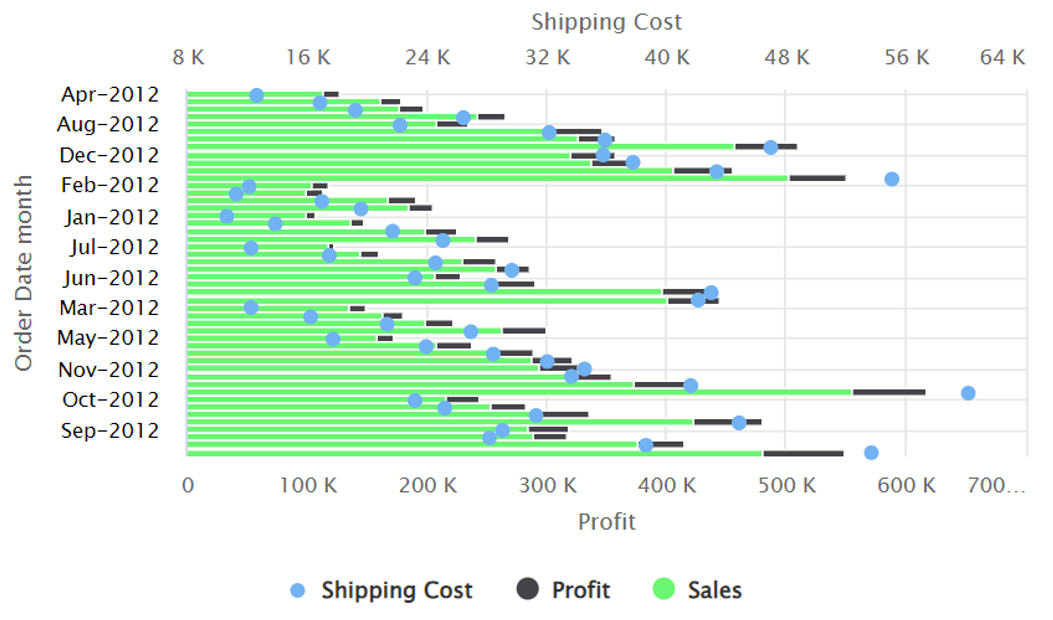
Example: The company can utilize the Symbol Stacked Chart as a convenient tool for monthly monitoring of profit, sales, and shipping costs.
Horizontal Symbol Stacked Chart
Vertical Symbol Stacked Chart