Root Cause Analysis (RCA)
Root Cause Analysis (RCA) Using Lumenore Ask Me
This use case demonstrates how to perform a Root Cause Analysis (RCA) using Lumenore’s AI-powered conversational analytics tool, Ask Me. Whether you’re a business analyst or a decision-maker, this step-by-step guide helps you identify the reasons behind performance dips and take targeted action.
To illustrate this, we’ll explore a real scenario from a Retail superstore, using their sales data to investigate why sales dropped across a region during a specific period.
How to do it?
Step 1: Framing the Problem
We started by asking a simple question in the Ask Me interface:
“Show sales by region”

To understand the reason behind the low sales, we triggered Lumenore’s RCA workflow by asking:
“Why sales low in South?”
Step 2: Guided RCA Workflow
The AI assistant launched an automated RCA process structured into four logical steps:
- Pick Date & Frequency – We chose “Order Date” as the time field and set the frequency to “Quarterly.”
Note: “AI will automatically suggest the most relevant date and frequency columns labeled ‘AUTO’ based on historical patterns and user preferences.
- Change Analysis – Tracked its change in sales quarter-over-quarter.
- Top Contributors – Identified which segments and factors contributed most to the decline.
- Drill-down – The AI suggested filters (like product, categories, customers, or channels) to explore deeper.

Step 3: Change Analysis
After selecting the time range, we noticed a sharp sales drop from Q1 to Q2-2024:
- Q1-2024 Sales: $118.9K
- Q2-2024 Sales: $72.1K

Note: To change the period, type the required time. The RCA analysis will automatically update to reflect the new date range.
Top contributing factors for the sales drop between Q1 & Q2-2024:
|
Dimension |
Value |
Key Insight |
|
Customer Name |
Grant Thornton |
This customer contributed $9.9K in Q1 but made no purchases in Q2. A 100% drop, explaining 21% of the decline. |
|
Order Priority |
Medium |
Sales dropped by $25.62K, a 35.7% decline. It made the highest contribution to sales in Q1. |
|
Ship Mode |
Standard |
Declined from $63.9K to $40.6K, indicating a 36% drop. Possibly linked to fewer deliveries or shipping delays. |
|
Customer Segment |
Individual |
Dropped $24.3K, a 41% decrease. This segment may have lost interest or reduced spending |
|
Country |
United States |
Sales fell by 62.2%, which shows the impact of national-level trends or seasonality. |
|
Category |
Technology |
Experienced a 63% drop, the largest contributor (66%) to the overall decline. |
|
Channel |
Social media |
Dropped by $18.5K, a 67% decrease. Likely due to reduced campaign performance or spend. |
|
State |
North Carolina |
Sales declined by $13.9K (79%). This region needs special attention. |
|
Sub Category |
Machines |
Dropped almost entirely (97%), indicating a major fall in machine-related sales. |
Interpretation
- Grant Thornton’s inactivity alone explains 21% of the sales drop. Losing such key customers can have a major impact.
- Technology category, medium-priority orders, and social media channels were key contributors to the drop.
- North Carolina’s steep decline (79%) shows potential regional issues.
- Machines underperformed severely — from $12.4K to just $423.
Step 4: Deep Dive on Key Filters
By filtering specifically for Category: Technology, we found:
- Sales in Q1–2024: $49.3K
- Sales in Q2–2024: $18.4K
- Total drop: –$30.9K (a decline of over 60%)
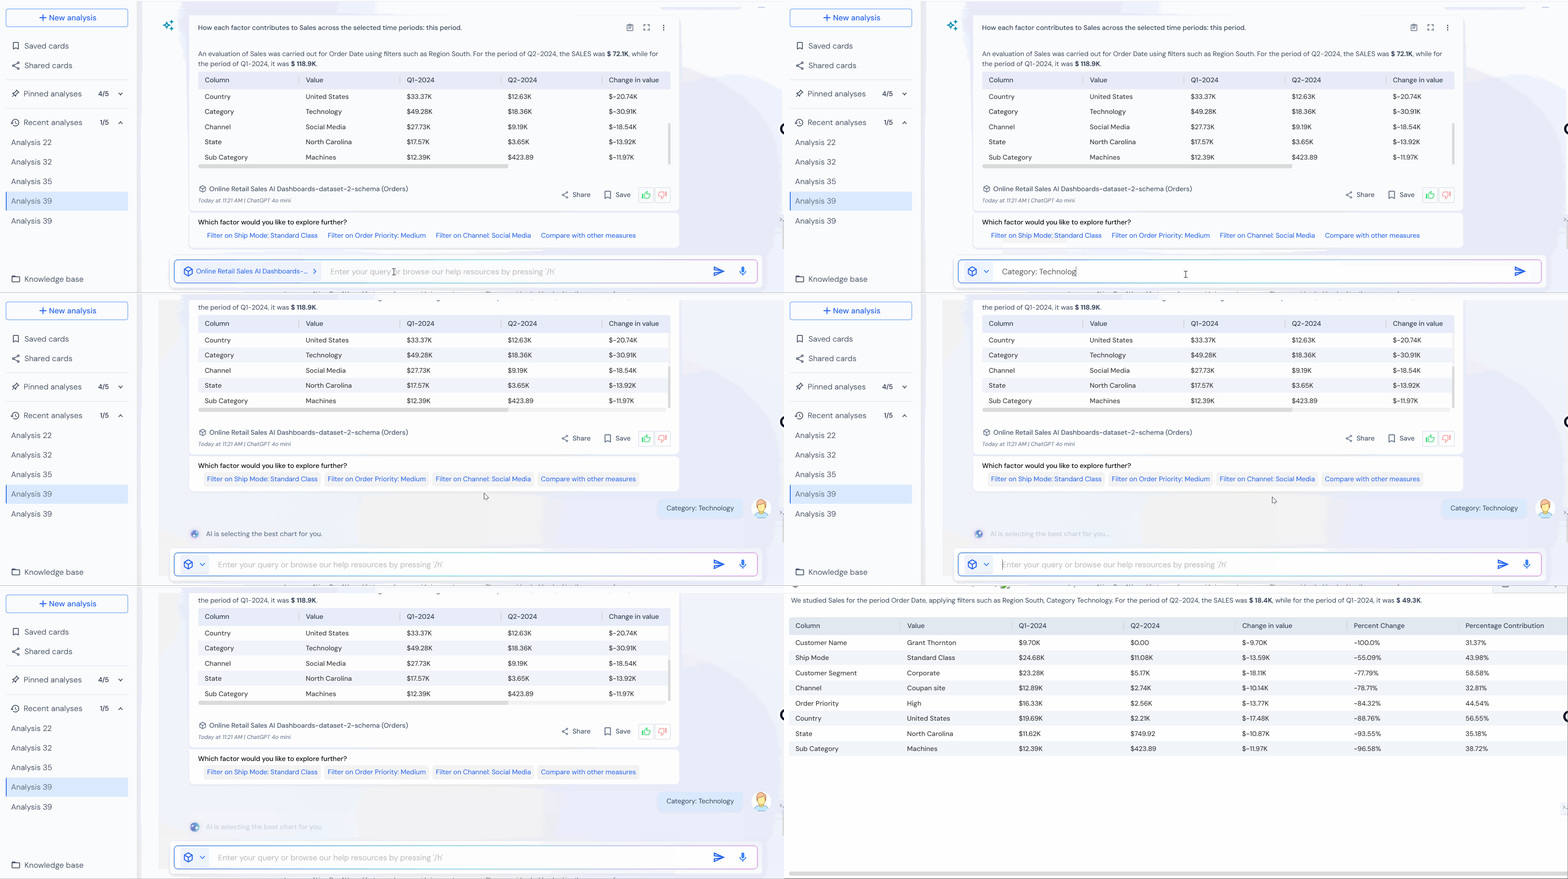
Factors Contributing to the drop in sales:
|
Factor |
Value |
Observation |
|
Customer Name |
Grant Thornton |
Went from contributing $9.7K to $0 → 100% drop. This alone explains 31% of the loss. |
|
Ship Mode |
Standard Class |
Dropped by 55% → from $24.68K to $11.08K. This affected shipping-related sales significantly. |
|
Customer Segment |
Corporate |
Declined from $23.28K to $5.17K → a 78% drop. Indicates reduced corporate engagement. |
|
Channel |
Coupon Site |
Fell by nearly 79% → suggests coupon-driven sales slowed heavily. |
|
Order Priority |
High |
High-priority orders decreased by 84% → fewer urgent or important orders were placed. |
|
Country |
United States |
Overall drop in U.S. sales by 89% → may indicate wider market conditions. |
|
State |
North Carolina |
Decline from $11.62K to $749.92 → sharp regional fall. |
|
Sub-Category |
Machines |
Saw a 96.58% reduction → nearly wiped out, possibly due to supply or demand issues. |
Interpretation
- Grant Thornton (a key customer) made no purchases in Q2–2024. That alone explains a big part of the revenue drop.
- Other drops occurred across key channels, customer segments, and high-ticket items like Machines.
- The fall wasn’t due to just one issue, its multi-dimensional, affecting logistics, customer type, channel, and geography.
Next, filter on Subcategory: Machines.
- Sales in Q1–2024: $12.4K
- Sales in Q2–2024: $423.9
- Total drop in sales: Over $11.9K

Factors Contributing to the Drop
|
Factor |
What Happened? |
Change in Value |
% Drop |
Contribution to Decline |
|
Grant Thornton |
A key customer who spent $9.7K in Q1 bought nothing in Q2. |
–$9.7K |
–100% |
81% |
|
Same Day Shipping |
Used in Q1 but not at all in Q2. |
–$9.7K |
–100% |
81% |
|
North Carolina |
Sales from this state vanished. |
–$9.7K |
–100% |
81% |
|
Corporate Segment |
Spent $11.1K in Q1 but only $159 in Q2. |
–$11K |
–98.6% |
92% |
|
Coupan Site Channel |
Sales through this marketing channel dropped hard. |
–$9.6K |
–98.8% |
80% |
|
Order Priority: High |
Surprisingly, this increased slightly in value ($159 in Q2), but overall sales still crashed due to other factors. |
Interpretation
The sales drop was mainly because:
- A key customer (Grant Thornton) stopped buying.
- Sales through the Coupan site and using Same Day shipping were eliminated.
- The Corporate segment and North Carolina contributed heavily to sales in Q1, but not in Q2.
Filter: Compare with other measures
- Sales in Q1–2024: $12.4K
- Sales in Q2–2024: $423.9
- Change: -$12K+ (a 96.6%+ drop)

Step 6: Supporting Metrics & Correlation
Key KPIs
|
Metric |
% Drop |
Correlation with Sales |
|
Sum of Discounted Sales |
-54.98% |
0.81 |
|
Sum of Net Profit |
-55.1% |
0.79 |
|
Sum of Order Discount |
-51.6% |
0.73 |
|
Sales to Shipping Cost Ratio |
-49.02% |
0.61 |
- Shipping Cost Impact
-
- Total Shipping Cost dropped: from $180K → $79K (down ~56%)
- Average Shipping Cost per Order & Item also dropped by ~54%
- Shipping Cost to Sales Ratio fell by 49%
Why this matters:
-
- A sharp drop in shipping cost usually means fewer orders shipped, which directly impacts sales.
- If fewer customers placed orders or opted for cheaper/slower shipping, it could suggest:
- Less demand
- Delivery/logistics issues
- Change in customer preference (e.g., Same Day shipping fell to $0)
Conclusion: Lower shipping activity = lower product movement = lower sales.
- Profit Impact
-
- Net Profit dropped: $201K → $90K (down ~55%)
- Overall Profit dropped: $204K → $91K
Why this matters:
-
- Profit drop reflects either fewer sales, reduced margins, or both.
- Lower profit means:
- Fewer high-margin products sold
- Possible increase in operational costs
- Customer churn or fewer large deals
Conclusion: Declining profit shows business health is weakening alongside revenue.
- Discounted Sales Impact
-
- Discounted Sales dropped: $1.67M → $750K (down ~55%)
- Discounts per order also dropped significantly
Why this matters:
-
- In Q1–2024, discounting was a key sales driver.
- Fewer discounts in Q2 may have:
- Reduced purchase incentives
- Made products less appealing to price-sensitive buyers
- Caused drop in conversion, especially from channels like “Coupon Sites”
Conclusion: No discounts = fewer purchases, especially from deal-driven segments.
Summary
|
Metric |
Drop (%) |
Root Cause Logic |
|
Shipping Cost |
~56% |
Fewer orders shipped = less product movement = lower revenue |
|
Discounted Sales |
~55% |
Less incentive = fewer conversions (especially from coupons) |
|
Net Profit |
~55% |
Less volume sold and/or reduced margin on what was sold |
|
Sales |
~55% |
Result of all above factors combined |
Interpretation:
- All critical sales and profit metrics dropped by 50–55%.
- Discounts, orders, and shipping costs all fell significantly.
- Strong correlation (0.81) shows that as these measures fell, so did sales.
Impact on Overall Sales
- Strong Correlation (0.81): Suggests this is a key driver of sales performance.
- Lower Discounts = Lower Incentives: May have discouraged customers from placing orders (especially price-sensitive ones).
- Volume Decline: A drop in discounted sales often mirrors a decline in total order volume, especially if discounts are standard practice in Q2.
Conclusion: What Caused the Sales Drop?
- Loss of a key customer (Grant Thornton)
- Reduced shipping and logistical activity
- Less discounting, fewer incentives for price-sensitive buyers
- Sharp drop in Machines and Technology category
- Weak channel and regional performance
Business Recommendations
- Re-engage high-value customers through outreach
- Relaunch discount-based campaigns (esp. in Coupon channels)
- Diversify customer base and channels to reduce dependency
- Audit North Carolina and improve logistics performance
- Monitor discount trends and align with customer behavior
